Angular 17 Highcharts Example Tutorial
Hello Developer,
This article will give you an example of an angular 17 highcharts example. We will use the angular 17 highcharts-angular example. This post will give you a simple example of how to use highcharts in angular 17. If you want to see examples of how to use highcharts in angular 17, you are in the right place. Let’s start with how to install highcharts in angular 17 .
Angular 17 Highcharts is a powerful tool for creating interactive and visually appealing charts in web applications. It seamlessly integrates with Angular 17, allowing developers to easily incorporate dynamic charts into their projects. With features like data binding and real-time updates, users can visualize data effortlessly. Its flexibility and customization options make it suitable for various industries and data presentation needs. Whether it's displaying complex financial data or simple progress indicators, Angular 17 Highcharts simplifies the process of creating compelling visualizations.
In this example, we use the highcharts library to create a line chart. We will install the highcharts-angular and highcharts npm package to use the highcharts library functionality. Just look at the steps below.
So, let's follow the following steps:
Step for How to Add Highcharts in Angular 17?
- Step 1: Create Angular 17 Project
- Step 2: Install highcharts-angular
- Step 3: Update Ts File
- Step 4: Update HTML File
- Run Angular App
Let's follow the steps:
Step 1: Create Angular 17 Project
You can easily create your angular app using the below command:
ng new my-new-app
Step 2: Install highcharts-angular
Install the Install highcharts-angular and highcharts libraries.
npm install highcharts-angular --save
npm install highcharts --save
Step 3: Update Ts File
here, we need to update ts file as like bellow with lat and long variable:
src/app/app.component.ts
import { Component, CUSTOM_ELEMENTS_SCHEMA } from '@angular/core';
import { CommonModule } from '@angular/common';
import { HighchartsChartModule } from 'highcharts-angular';
import * as Highcharts from 'highcharts';
@Component({
selector: 'app-root',
standalone: true,
imports: [CommonModule, HighchartsChartModule],
templateUrl: './app.component.html',
styleUrls: ['./app.component.css'],
schemas: [ CUSTOM_ELEMENTS_SCHEMA ]
})
export class AppComponent {
title = 'myHighchart';
Highcharts: typeof Highcharts = Highcharts;
chartOptions: Highcharts.Options = {
series: [{
data: [50, 40, 60, 45, 70, 42, 60],
type: 'line'
}]
};
}
Step 4: Update HTML File
here, we need to update html file as like bellow code:
src/app/app.component.html
<h1>Angular 17 Highcharts Example - ItSolutionStuff.com</h1>
<highcharts-chart
[Highcharts]="Highcharts"
[options]="chartOptions"
style="width: 100%; height: 400px; display: block;"
></highcharts-chart>
Run Angular App:
All the required steps have been done, now you have to type the given below command and hit enter to run the Angular app:
ng serve
Now, Go to your web browser, type the given URL and view the app output:
http://localhost:4200
Preview:
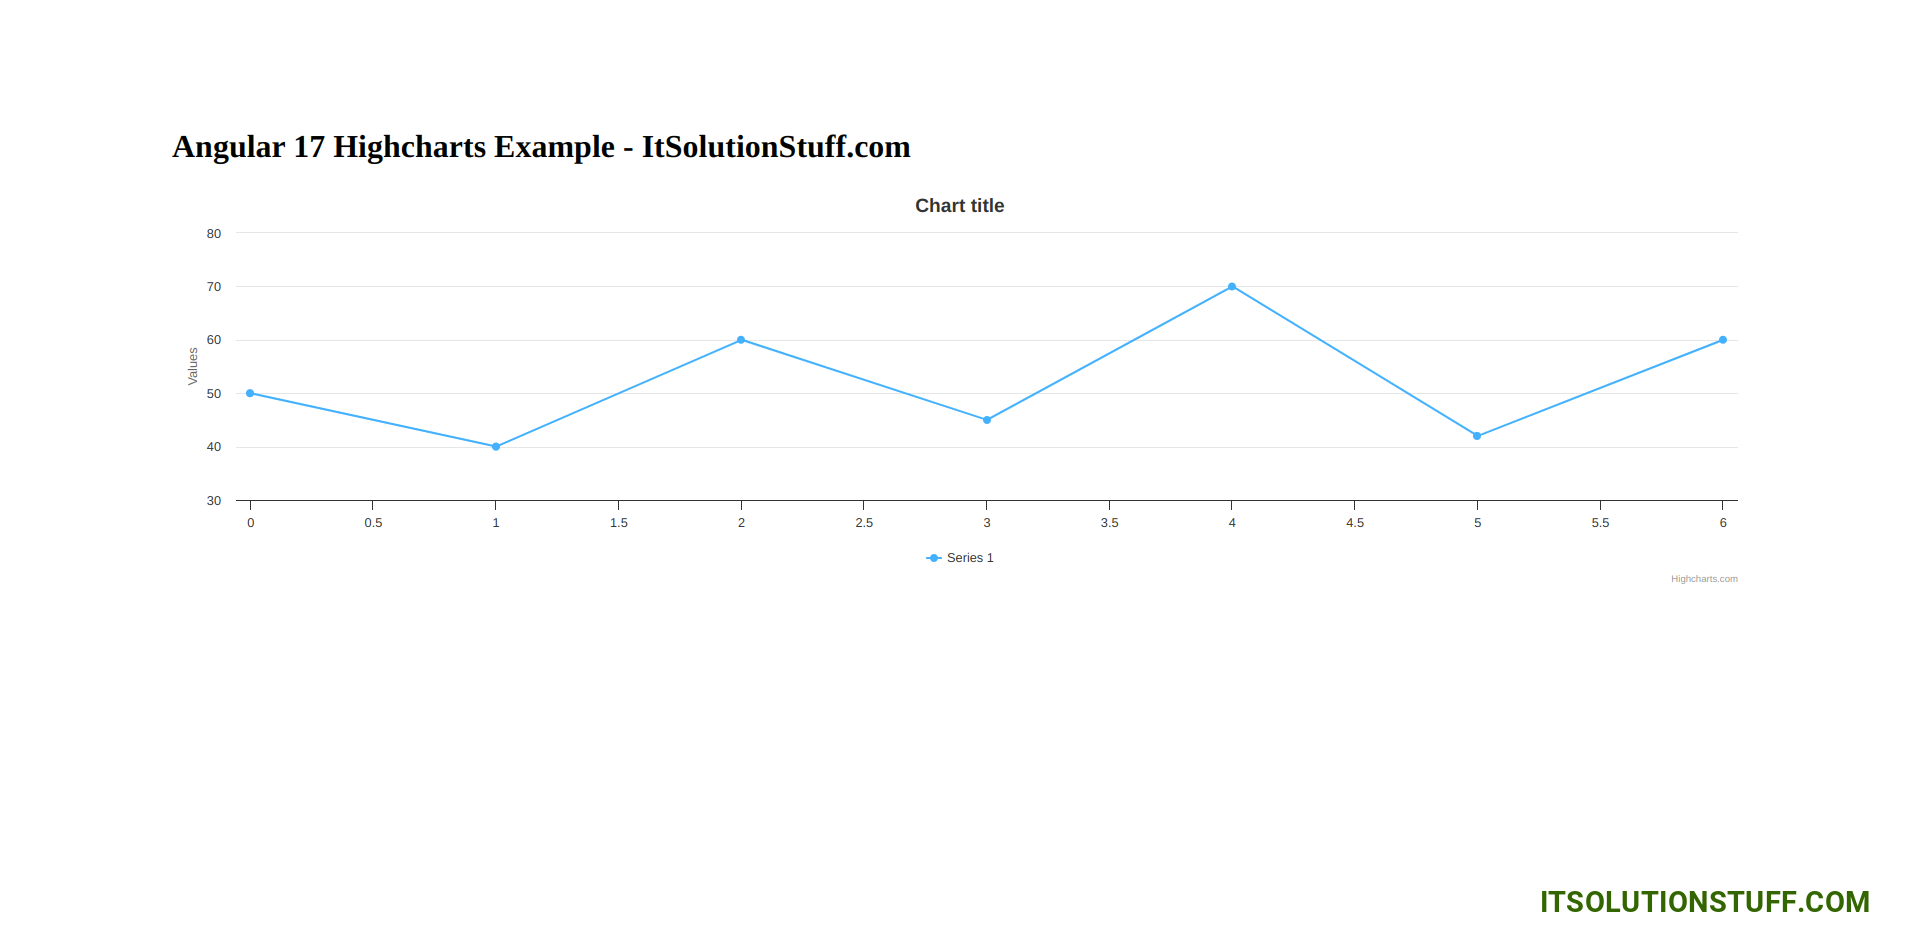
now you can check it.
I hope it can help you...