Angular 17 Chart JS using ng2-charts Example
Hi Developer,
I am going to explain to you example of angular 17 charts example. let’s discuss about angular 17 chart js using ng2-charts. I explained simply step by step angular 17 chart js. you can understand a concept of angular 17 ng2 charts examples. Alright, let’s dive into the steps.
The ng2-charts package offers a chart js for line charts, pie charts, Bar charts, Doughnut charts etc. in this example, we will create simple like charts using ng2-charts package. so, let's follow the following steps:
Step for How to Add Charts in Angular 17
- Step 1: Create Angular 17 Project
- Step 2: Install ng2-charts Package
- Step 3: Update Ts File
- Step 4: Update HTML File
- Run Angular App
Let's follow the steps:
Step 1: Create Angular 17 Project
You can easily create your angular app using below command:
ng new my-new-app
Step 2: Install ng2-charts Package
Now in this step, we need to just install ng2-charts in our angular application. so let's add as like bellow:
npm install ng2-charts --save
Step 3: Update Ts File
here, we need to update ts file as like bellow with lat and long variable:
src/app/app.component.ts
import { Component } from '@angular/core';
import { CommonModule } from '@angular/common';
import { NgChartsModule } from 'ng2-charts';
import { ChartConfiguration, ChartOptions, ChartType } from "chart.js";
@Component({
selector: 'app-root',
standalone: true,
imports: [CommonModule, NgChartsModule],
templateUrl: './app.component.html',
styleUrls: ['./app.component.css']
})
export class AppComponent {
title = 'ng2-charts-demo';
public lineChartData: ChartConfiguration<'line'>['data'] = {
labels: [
'January',
'February',
'March',
'April',
'May',
'June',
'July',
'August',
'September',
'October',
'November',
'December'
],
datasets: [
{
data: [ 40, 45, 50, 55, 60, 65, 70, 75, 70, 60, 50, 45 ],
label: 'Angular',
fill: true,
tension: 0.5,
borderColor: 'black',
backgroundColor: 'rgba(255,0,0,0.3)'
},
{
data: [ 45, 50, 60, 70, 75, 65, 50, 60, 55, 50, 45, 45 ],
label: 'React',
fill: true,
tension: 0.5,
borderColor: 'black',
backgroundColor: 'rgba(0,255,0,0.3)'
}
]
};
public lineChartOptions: ChartOptions<'line'> = {
responsive: false
};
public lineChartLegend = true;
}
Step 4: Update HTML File
here, we need to update html file as like bellow code:
src/app/app.component.html
<h1>Angular 17 Chart JS using ng2-charts Example - ItSolutionStuff.com</h1>
<div style="display: block;">
<canvas baseChart width="800" height="400"
[type]="'line'"
[data]="lineChartData"
[options]="lineChartOptions"
[legend]="lineChartLegend">
</canvas>
</div>
Run Angular App:
All the required steps have been done, now you have to type the given below command and hit enter to run the Angular app:
ng serve
Now, Go to your web browser, type the given URL and view the app output:
http://localhost:4200
Preview:
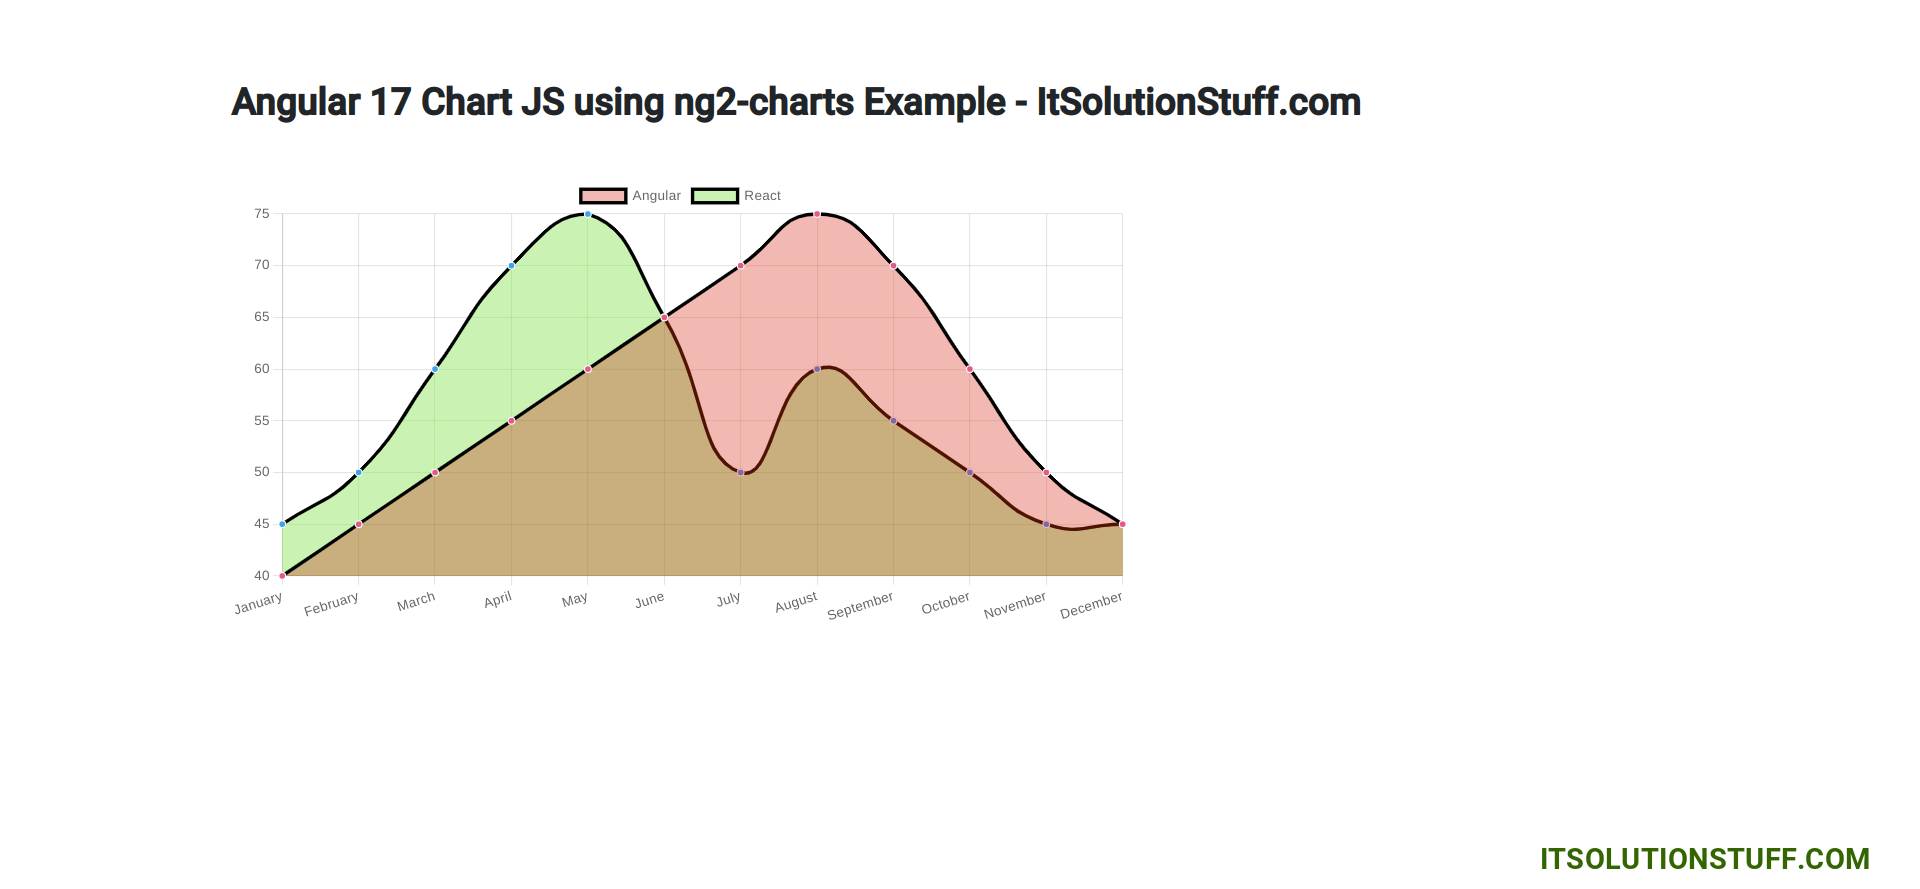
now you can check it.
I hope it can help you...