Angular Google Bar Chart Example
This tutorial shows you angular google bar chart example. it's simple example of angular google bar chart npm. This post will give you simple example of angular angular-google-charts google bar chart . Here you will learn how to add google bar chart in angular.
you can easily add google api bar chart in angular 6, angular 7, angular 8, angular 9, angular 10, angular 11, angular 12, angular 13, angular 14, angular 15, angular 16 and angular 17 version app.
In this example we will use angular-google-charts npm package to create google api bar chart example in angular 11 application. we will simply install that angular-google-charts npm package and use GoogleChartsModule module to create code.
So, let's see bellow step and get qr code as like bellow screenshot:
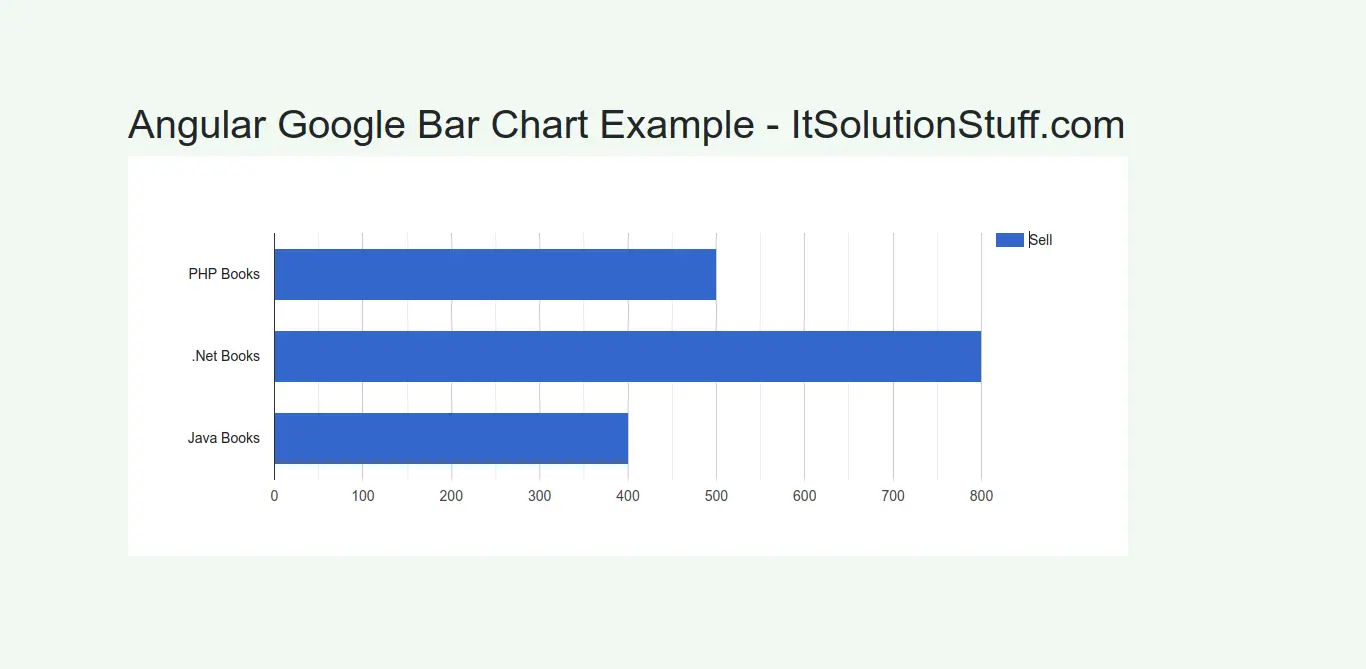
Preview:
Step 1: Create New App
You can easily create your angular app using bellow command:
ng new myNewApp
Step 2: Install angular-google-charts npm Package
Now in this step, we need to just install angular-google-charts in our angular application. so let's add as like bellow:
npm install angular-google-charts
Step 3: Import GoogleChartsModule
we will import GoogleChartsModule module as like bellow code:
src/app/app.module.ts
import { BrowserModule } from '@angular/platform-browser';
import { NgModule } from '@angular/core';
import { AppComponent } from './app.component';
import { GoogleChartsModule } from 'angular-google-charts';
@NgModule({
declarations: [
AppComponent
],
imports: [
BrowserModule,
GoogleChartsModule
],
providers: [],
bootstrap: [AppComponent]
})
export class AppModule { }
Step 4: Update Ts File
here, we need to update ts file as like bellow:
src/app/app.component.ts
import { Component } from '@angular/core';
@Component({
selector: 'app-root',
templateUrl: './app.component.html',
styleUrls: ['./app.component.css']
})
export class AppComponent {
chartData = {
type: 'BarChart',
data: [
["PHP Books", 500],
[".Net Books", 800],
["Java Books", 400],
],
chartColumns: ['Books', 'Sell'],
width: 1000,
height: 400
};
}
Step 5: Update HTML File
here, we need to update html file as like bellow code:
src/app/app.component.html
<h1>Angular Google Bar Chart Example - ItSolutionStuff.com</h1>
<google-chart
[type]="chartData.type"
[data]="chartData.data"
[columns]="chartData.chartColumns"
[width]="chartData.width"
[height]="chartData.height">
</google-chart>
Now you can run by bellow command:
ng serve
now you can check it.
I hope it can help you...