Angular Line Chart Example Tutorial
Hi,
This simple article demonstrates of angular line chart example. We will use angular line chart npm. i explained simply about angular ng2-charts line chart . if you have question about how to add line chart in angular then i will give simple example with solution.
In this example we will use ng2-charts npm package to create line chart example in angular 11 application. we will simply install that ng2-charts npm package and use ChartsModule module to create code.
you can easily add line chart in angular 6, angular 7, angular 8, angular 9, angular 10, angular 11, angular 12, angular 13, angular 14, angular 15, angular 16 and angular 17 version app.
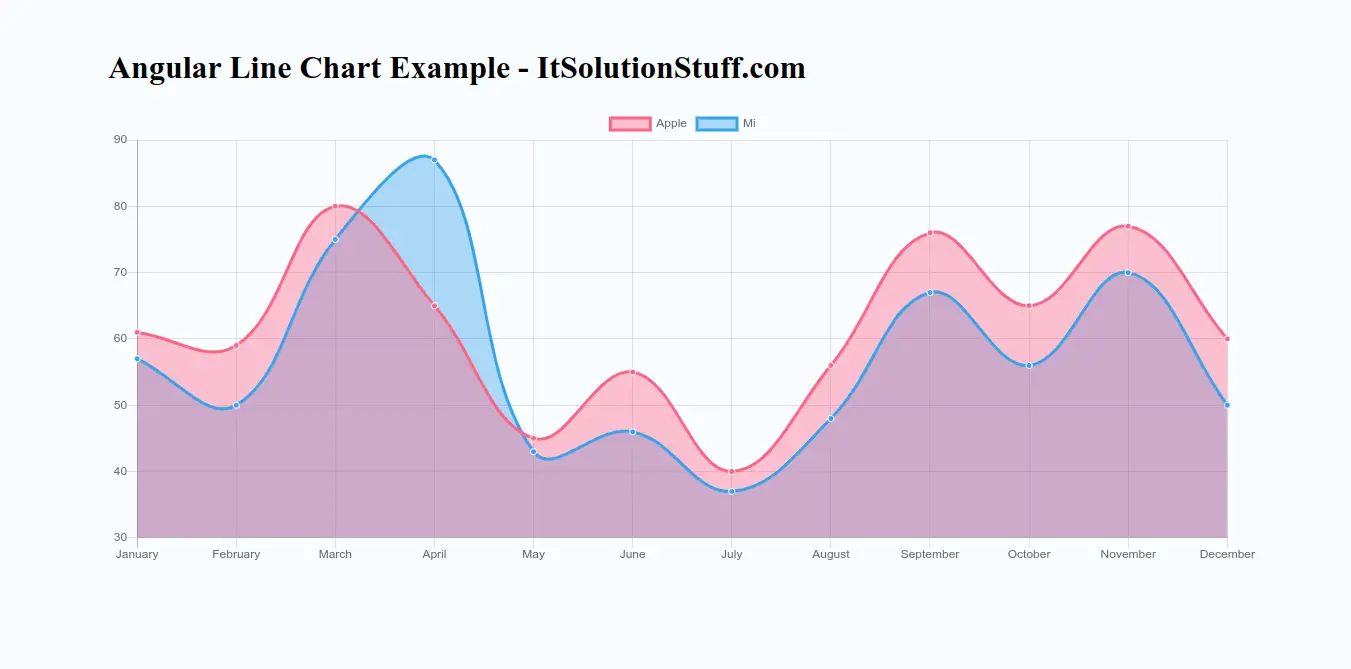
So, let's see bellow step and get qr code as like bellow screenshot:
Preview:
Step 1: Create New App
You can easily create your angular app using bellow command:
ng new myNewApp
Step 2: Install ng2-charts npm Package
Now in this step, we need to just install ng2-charts in our angular application. so let's add as like bellow:
npm install ng2-charts chart.js --save
Step 3: Import ChartsModule
we will import ChartsModule module as like bellow code:
src/app/app.module.ts
import { NgModule } from '@angular/core';
import { BrowserModule } from '@angular/platform-browser';
import { FormsModule } from '@angular/forms';
import { AppComponent } from './app.component';
import { ChartsModule } from 'ng2-charts';
@NgModule({
imports: [ BrowserModule, FormsModule, ChartsModule ],
declarations: [ AppComponent ],
bootstrap: [ AppComponent ]
})
export class AppModule { }
Step 4: Update Ts File
here, we need to update ts file as like bellow:
src/app/app.component.ts
import { Component, OnInit, ViewChild } from '@angular/core';
import { ChartDataSets, ChartOptions } from 'chart.js';
import { Color, Label } from 'ng2-charts';
@Component({
selector: 'my-app',
templateUrl: './app.component.html',
styleUrls: [ './app.component.css' ]
})
export class AppComponent {
public lineChartData: ChartDataSets[] = [
{ data: [61, 59, 80, 65, 45, 55, 40, 56, 76, 65, 77, 60], label: 'Apple' },
{ data: [57, 50, 75, 87, 43, 46, 37, 48, 67, 56, 70, 50], label: 'Mi' },
];
public lineChartLabels: Label[] = ['January', 'February', 'March', 'April', 'May', 'June', 'July', 'August', 'September', 'October', 'November', 'December'];
public lineChartOptions: (ChartOptions & { annotation: any }) = {
responsive: true,
};
public lineChartLegend = true;
public lineChartType = 'line';
public lineChartPlugins = [];
constructor() { }
ngOnInit() {
}
}
Step 5: Update HTML File
here, we need to update html file as like bellow code:
src/app/app.component.html
<h1>Angular Line Chart Example - ItSolutionStuff.com</h1>
<div style="display: block;">
<canvas baseChart width="500" height="200"
[datasets]="lineChartData"
[labels]="lineChartLabels"
[options]="lineChartOptions"
[colors]="lineChartColors"
[legend]="lineChartLegend"
[chartType]="lineChartType"
[plugins]="lineChartPlugins">
</canvas>
</div>
Now you can run by bellow command:
ng serve
now you can check it.
I hope it can help you...