Angular 11 Bar Chart using ng2-charts Example
This tutorial will give you example of angular 11 bar chart example. you can see angular 11 bar chart npm. we will help you to give example of angular 11 ng2-charts bar chart . you can see how to add bar chart in angular 11. Let's see bellow example angular 11 bar chart example.
In this example we will use ng2-charts npm package to create bar chart example in angular 11 application. we will simply install that ng2-charts npm package and use ChartsModule module to create code.
So, let's see bellow step and get qr code as like bellow screenshot:
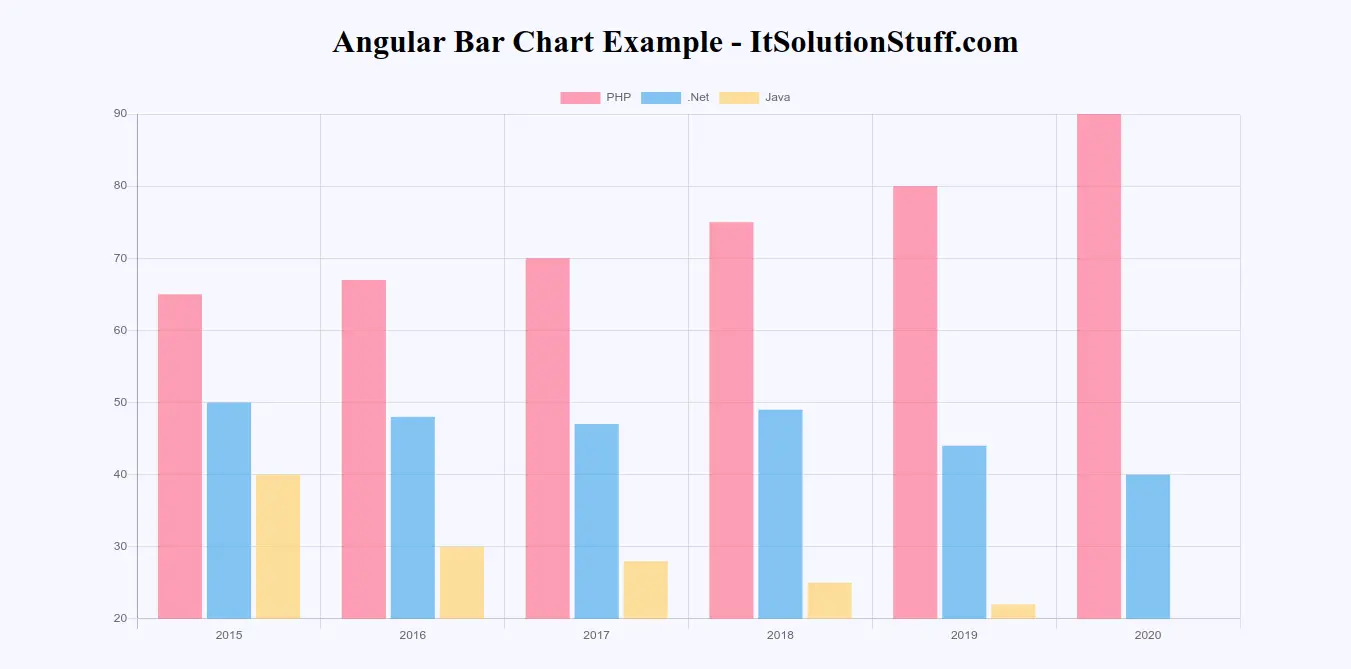
Preview:
Step 1: Create New App
You can easily create your angular app using bellow command:
ng new myNewApp
Step 2: Install ng2-charts npm Package
Now in this step, we need to just install ng2-charts in our angular application. so let's add as like bellow:
npm install ng2-charts chart.js --save
Step 3: Import ChartsModule
we will import ChartsModule module as like bellow code:
src/app/app.module.ts
import { NgModule } from '@angular/core';
import { BrowserModule } from '@angular/platform-browser';
import { FormsModule } from '@angular/forms';
import { AppComponent } from './app.component';
import { ChartsModule } from 'ng2-charts';
@NgModule({
imports: [ BrowserModule, FormsModule, ChartsModule ],
declarations: [ AppComponent ],
bootstrap: [ AppComponent ]
})
export class AppModule { }
Step 4: Update Ts File
here, we need to update ts file as like bellow:
src/app/app.component.ts
import { Component, OnInit } from '@angular/core';
import { ChartOptions, ChartType, ChartDataSets } from 'chart.js';
import { Label } from 'ng2-charts';
@Component({
selector: 'my-app',
templateUrl: './app.component.html',
styleUrls: [ './app.component.css' ]
})
export class AppComponent {
public barChartOptions: ChartOptions = {
responsive: true,
};
public barChartLabels: Label[] = ['2015', '2016', '2017', '2018', '2019', '2020'];
public barChartType: ChartType = 'bar';
public barChartLegend = true;
public barChartPlugins = [];
public barChartData: ChartDataSets[] = [
{ data: [65, 67, 70, 75, 80, 90], label: 'PHP' },
{ data: [50, 48, 47, 49, 44, 40], label: '.Net' },
{ data: [40, 30, 28, 25, 22, 20], label: 'Java' },
];
constructor() { }
ngOnInit() {
}
}
Step 5: Update HTML File
here, we need to update html file as like bellow code:
src/app/app.component.html
<h1>Angular Bar Chart Example - ItSolutionStuff.com</h1>
<div style="display: block;" >
<canvas baseChart
[datasets]="barChartData"
[labels]="barChartLabels"
[options]="barChartOptions"
[plugins]="barChartPlugins"
[legend]="barChartLegend"
[chartType]="barChartType">
</canvas>
</div>
Now you can run by bellow command:
ng serve
now you can check it.
I hope it can help you...