Angular 12 Chart Js using ng2-charts Examples
Hi,
In this post, we will learn angular 12 chart example. you'll learn angular 12 chart js. it's simple example of angular 12 ng2 charts examples. We will use how to add chart.js in angular 12.
If you want to add chart in your angular 12 project then we will suggest you to use ng2-charts npm package to adding chart. ng2-charts provide line chart, pie chart, bar chart, doughnut chart, radar chart, polar area chat, bubble chart and scatter chart. here, i will give you example with integrate three chart.
so let's see bellow example here:
Create New App
You can easily create your angular app using bellow command:
ng new myNewApp
Install ng2-charts npm Package
Now in this step, we need to just install ng2-charts in our angular application. so let's add as like bellow:
npm install ng2-charts chart.js --save
Import ChartsModule
we will import ChartsModule module as like bellow code:
src/app/app.module.ts
import { NgModule } from '@angular/core';
import { BrowserModule } from '@angular/platform-browser';
import { FormsModule } from '@angular/forms';
import { AppComponent } from './app.component';
import { ChartsModule } from 'ng2-charts';
@NgModule({
imports: [ BrowserModule, FormsModule, ChartsModule ],
declarations: [ AppComponent ],
bootstrap: [ AppComponent ]
})
export class AppModule { }
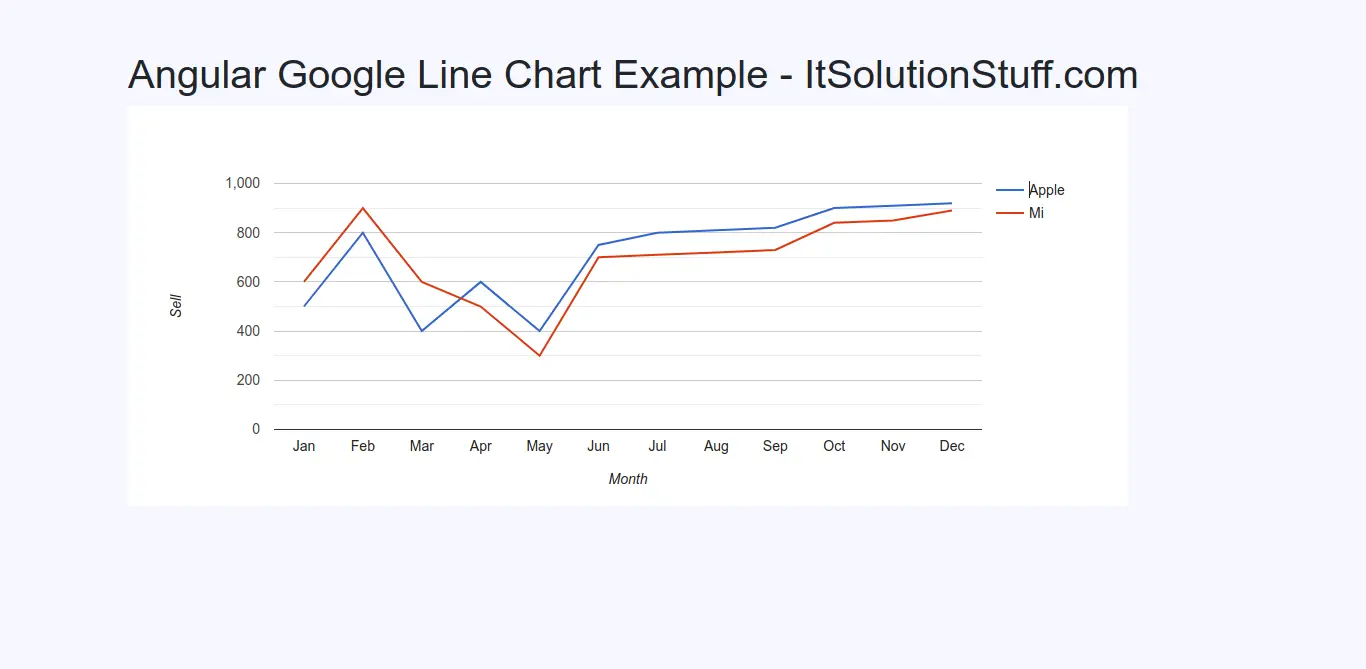
Line Chart Example
Here, generate new component for line chart:
ng g c line-chart
src/app/line-chart/line-chart.component.ts
import { Component, OnInit } from '@angular/core';
import { ChartDataSets, ChartOptions } from 'chart.js';
import { Color, Label } from 'ng2-charts';
@Component({
selector: 'app-line-chart',
templateUrl: './line-chart.component.html',
styleUrls: ['./line-chart.component.css']
})
export class LineChartComponent implements OnInit {
public lineChartData: ChartDataSets[] = [
{ data: [61, 59, 80, 65, 45, 55, 40, 56, 76, 65, 77, 60], label: 'Apple' },
{ data: [57, 50, 75, 87, 43, 46, 37, 48, 67, 56, 70, 50], label: 'Mi' },
];
public lineChartLabels: Label[] = ['January', 'February', 'March', 'April', 'May', 'June', 'July', 'August', 'September', 'October', 'November', 'December'];
public lineChartOptions = {
responsive: true,
};
public lineChartLegend = true;
public lineChartType = 'line';
public lineChartPlugins = [];
constructor() { }
ngOnInit() {
}
}
src/app/line-chart/line-chart.component.html
<h1>Angular Line Chart Example - ItSolutionStuff.com</h1>
<div style="display: block;">
<canvas baseChart width="500" height="200"
[datasets]="lineChartData"
[labels]="lineChartLabels"
[options]="lineChartOptions"
[legend]="lineChartLegend"
[chartType]="lineChartType"
[plugins]="lineChartPlugins">
</canvas>
</div>
Ouput:
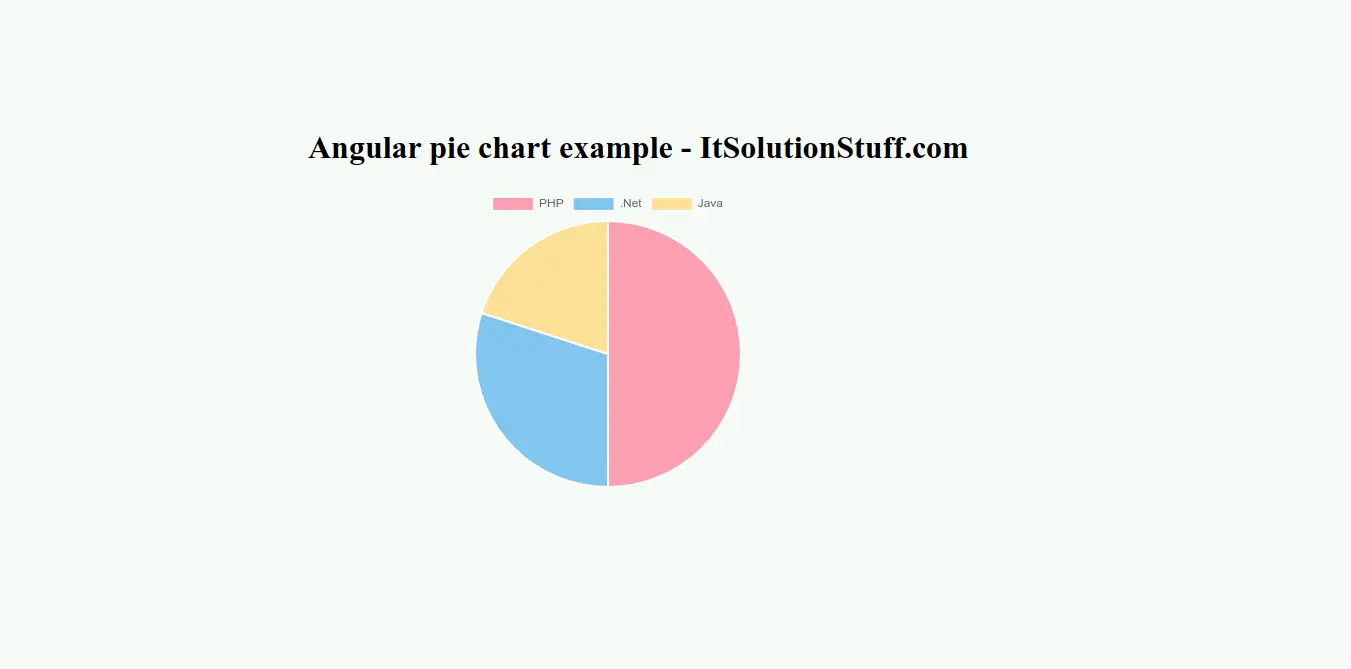
Pie Chart Example
Here, generate new component for pie chart:
ng g c pie-chart
src/app/pie-chart/pie-chart.component.ts
import { Component, OnInit } from '@angular/core';
import { ChartType, ChartOptions } from 'chart.js';
import { SingleDataSet, Label, monkeyPatchChartJsLegend, monkeyPatchChartJsTooltip } from 'ng2-charts';
@Component({
selector: 'app-pie-chart',
templateUrl: './pie-chart.component.html',
styleUrls: ['./pie-chart.component.css']
})
export class PieChartComponent implements OnInit {
public pieChartOptions: ChartOptions = {
responsive: true,
};
public pieChartLabels: Label[] = ['PHP', '.Net', 'Java'];
public pieChartData: SingleDataSet = [50, 30, 20];
public pieChartType: ChartType = 'pie';
public pieChartLegend = true;
public pieChartPlugins = [];
constructor() {
monkeyPatchChartJsTooltip();
monkeyPatchChartJsLegend();
}
ngOnInit(): void {
}
}
src/app/pie-chart/pie-chart.component.html
<h1>Angular pie chart example - ItSolutionStuff.com</h1>
<div class="chart-wrapper">
<canvas baseChart
[data]="pieChartData"
[labels]="pieChartLabels"
[chartType]="pieChartType"
[options]="pieChartOptions"
[plugins]="pieChartPlugins"
[legend]="pieChartLegend">
</canvas>
</div>
Ouput:
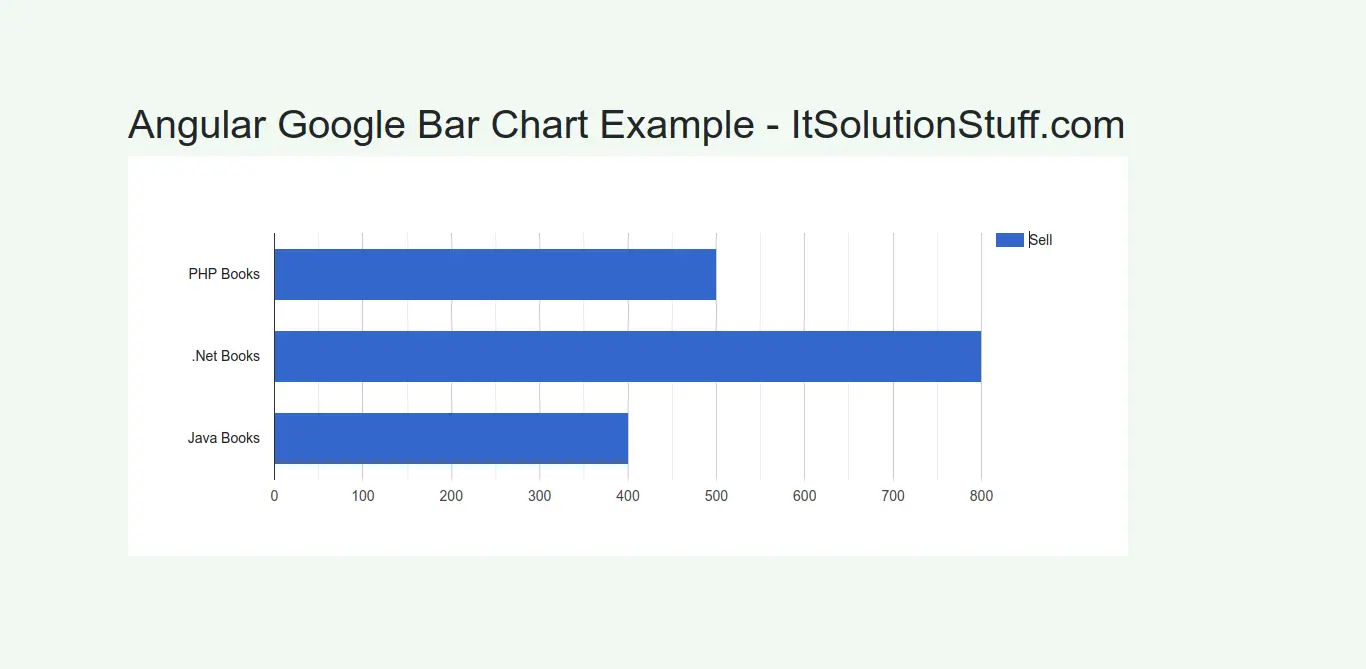
Bar Chart Example
Here, generate new component for line chart:
ng g c bar-chart
src/app/bar-chart/bar-chart.component.ts
import { Component, OnInit } from '@angular/core';
import { ChartOptions, ChartType, ChartDataSets } from 'chart.js';
import { Label } from 'ng2-charts';
@Component({
selector: 'app-bar-chart',
templateUrl: './bar-chart.component.html',
styleUrls: ['./bar-chart.component.css']
})
export class BarChartComponent implements OnInit {
public barChartOptions: ChartOptions = {
responsive: true,
};
public barChartLabels: Label[] = ['2015', '2016', '2017', '2018', '2019', '2020'];
public barChartType: ChartType = 'bar';
public barChartLegend = true;
public barChartPlugins = [];
public barChartData: ChartDataSets[] = [
{ data: [65, 67, 70, 75, 80, 90], label: 'PHP' },
{ data: [50, 48, 47, 49, 44, 40], label: '.Net' },
{ data: [40, 30, 28, 25, 22, 20], label: 'Java' },
];
constructor() { }
ngOnInit() {
}
}
src/app/bar-chart/bar-chart.component.html
<h1>Angular Bar Chart Example - ItSolutionStuff.com</h1>
<div style="display: block;" >
<canvas baseChart
[datasets]="barChartData"
[labels]="barChartLabels"
[options]="barChartOptions"
[plugins]="barChartPlugins"
[legend]="barChartLegend"
[chartType]="barChartType">
</canvas>
</div>
Ouput:
You can easily use reset of chart with ng2-charts.
I hope it can help you...