Laravel Google Pie Chart Example Tutorial
Hello,
This article will give you example of laravel google pie chart example. step by step explain laravel pie chart example. it's simple example of how to use google pie chart in laravel. you can understand a concept of google pie chart in laravel. Follow bellow tutorial step of laravel google pie chart tutorial.
we can simply create google pie chart in laravel 6, laravel 7, laravel 8, laravel 9, laravel 10 and laravel 11 version application.
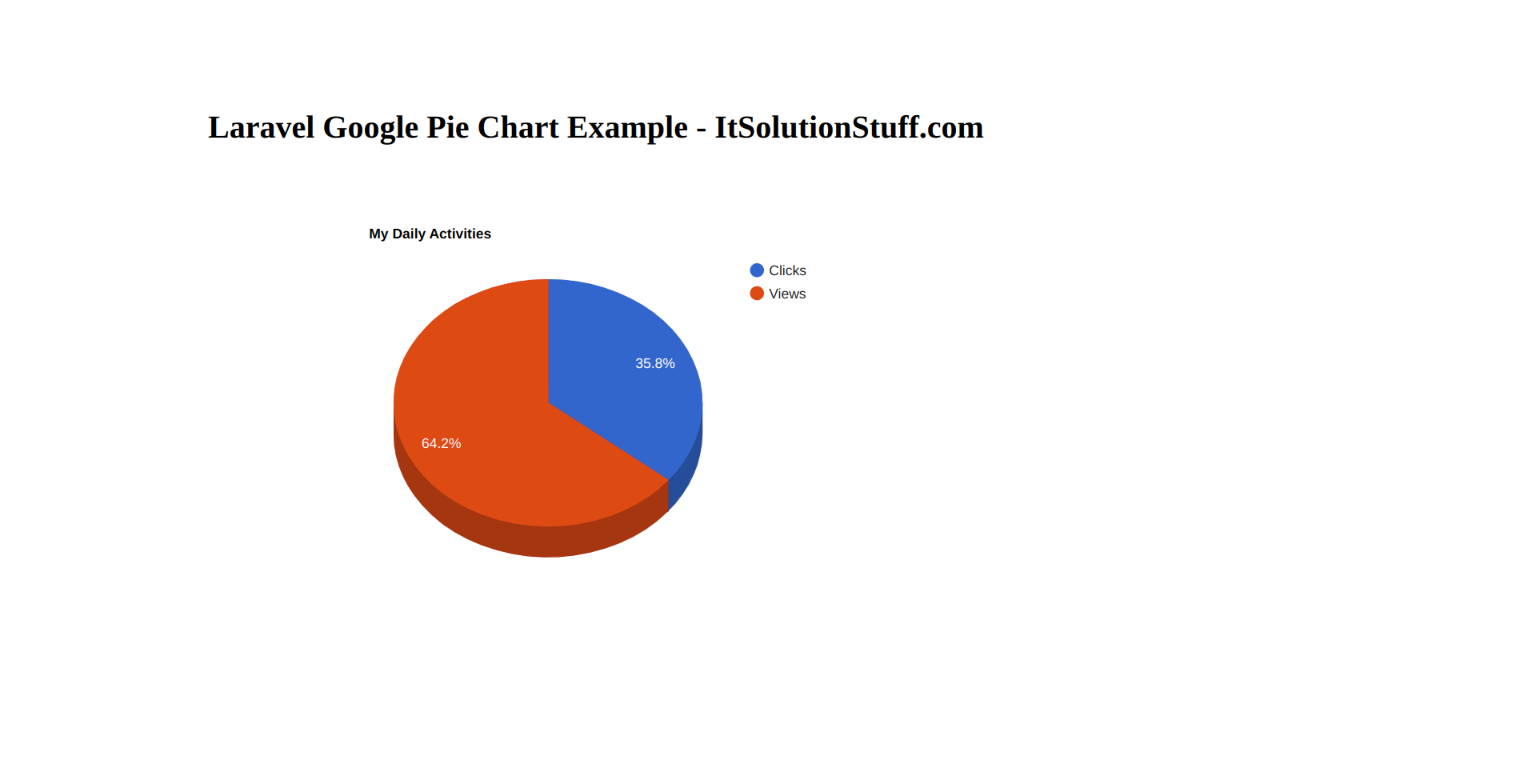
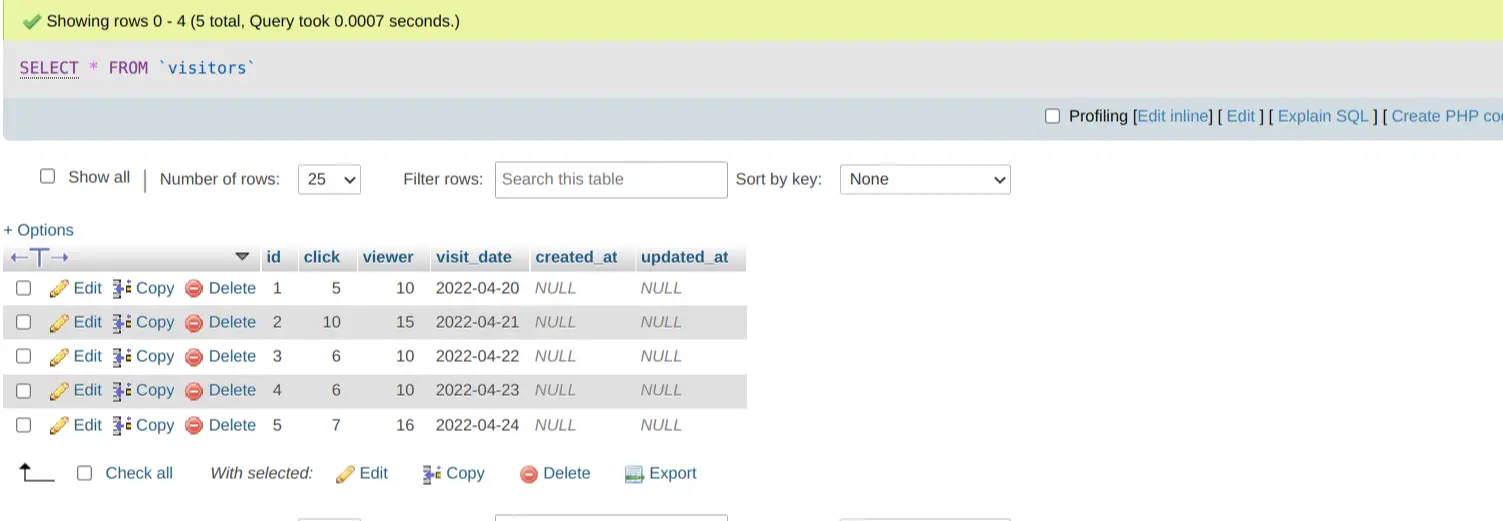
In this example, we will create a visitors table with a date, click, and views column. we will add dummy records every day. Then we fetch and display it in a google pie chart. So you can follow the below step and learn how to use the google pie chart in laravel.
Preview:
Step 1: Install Laravel
This is optional; however, if you have not created the laravel app, then you may go ahead and execute the below command:
composer create-project laravel/laravel example-app
Step 2: Create Migration and Model
we require to create new table "visitors" that way we will get data from this table, you can use your own table but this is for example. we have to create migration for visitors table using Laravel 5 php artisan command, so first fire bellow command:
php artisan make:migration create_visitors_table
After this command you will find one file in following path database/migrations and you have to put bellow code in your migration file for create visitors table.
<?php
use Illuminate\Database\Migrations\Migration;
use Illuminate\Database\Schema\Blueprint;
use Illuminate\Support\Facades\Schema;
return new class extends Migration
{
/**
* Run the migrations.
*
* @return void
*/
public function up()
{
Schema::create('visitors', function (Blueprint $table) {
$table->id();
$table->integer('click');
$table->integer('viewer');
$table->date('visit_date');
$table->timestamps();
});
}
/**
* Reverse the migrations.
*
* @return void
*/
public function down()
{
Schema::dropIfExists('visitor');
}
};
Ok, now you can add few records like as bellow:
Let's create model using bellow command:
php artisan make:model Visitor
app/Http/Controllers/HomeController.php
<?php
namespace App\Models;
use Illuminate\Database\Eloquent\Factories\HasFactory;
use Illuminate\Database\Eloquent\Model;
class Visitor extends Model
{
use HasFactory;
}
Step 3: Add Route
In this is step we need to add route for generate view. so open your route file and add following route.
routes/web.php
<?php
use Illuminate\Support\Facades\Route;
use App\Http\Controllers\GoogleController;
/*
|--------------------------------------------------------------------------
| Web Routes
|--------------------------------------------------------------------------
|
| Here is where you can register web routes for your application. These
| routes are loaded by the RouteServiceProvider within a group which
| contains the "web" middleware group. Now create something great!
|
*/
Route::get('google-chart', [GoogleController::class, 'googleLineChart']);
Step 4: Create Controller
If you haven't GoogleController then we should create new controller as GoogleController in this path app/Http/Controllers/GoogleController.php. Make sure you should have visitor table with some data. this controller will manage data and chart data and view file, so put bellow content in controller file:
app/Http/Controllers/GoogleController.php
<?php
namespace App\Http\Controllers;
use Illuminate\Http\Request;
use App\Models\Visitor;
use DB;
class GoogleController extends Controller
{
/**
* Write code on Method
*
* @return response()
*/
public function googleLineChart()
{
$visitors = Visitor::select(
DB::raw('SUM(click) as total_click'),
DB::raw('SUM(viewer) as total_viewer')
)
->orderBy(DB::raw("YEAR(created_at)"))
->groupBy(DB::raw("YEAR(created_at)"))
->get();
$result[] = ['Clicks','Viewers'];
foreach ($visitors as $key => $value) {
$result[++$key] = ["Clicks", (int)$value->total_click];
$result[++$key] = ["Views", (int)$value->total_viewer];
}
return view('googleChart', compact('result'));
}
}
Step 5: Create View File
In last step, we have to create view file "googleChart.blade.php" for generate view chart, so create googleChart file and put bellow code:
resources/view/googleChart.blade.php
<html>
<head>
<script type="text/javascript" src="https://www.gstatic.com/charts/loader.js"></script>
<script type="text/javascript">
google.charts.load("current", {packages:["corechart"]});
google.charts.setOnLoadCallback(drawChart);
function drawChart() {
var data = google.visualization.arrayToDataTable({{ Js::from($result) }});
var options = {
title: 'My Daily Activities',
is3D: true,
};
var chart = new google.visualization.PieChart(document.getElementById('piechart_3d'));
chart.draw(data, options);
}
</script>
</head>
<body>
<h1>Laravel Google Pie Chart Example - ItSolutionStuff.com</h1>
<div id="piechart_3d" style="width: 900px; height: 500px;"></div>
</body>
</html>
Run Laravel App:
All the required steps have been done, now you have to type the given below command and hit enter to run the Laravel app:
php artisan serve
Now, Go to your web browser, type the given URL and view the app output:
http://localhost:8000/google-chart
I hope it can help you...