Laravel 9 Google Charts Tutorial Example
Hello,
Here, I will show you how to work laravel 9 google charts. I explained simply about dynamic google charts in laravel 9. This article goes in detail on how to use google charts in laravel 9. if you have a question about how to add google in laravel 9 then I will give a simple example with a solution. Alright, let’s dive into the steps.
you can simply use Line Charts, Bar Charts, Pie Charts, Area Charts, etc using google chart library js.
In this example, we will create some dummy users records and then we will display a line chart with all months of current years. so let's follow the below step and add a chart in your laravel 9 app.
Step 1: Install Laravel 9
This is optional; however, if you have not created the laravel app, then you may go ahead and execute the below command:
composer create-project laravel/laravel example-app
Step 2: Create Route
first of all we will create simple route for creating simple line chart. so let's add simple routes as like bellow:
routes/web.php
<?php
use Illuminate\Support\Facades\Route;
use App\Http\Controllers\GoogleChartController;
/*
|--------------------------------------------------------------------------
| Web Routes
|--------------------------------------------------------------------------
|
| Here is where you can register web routes for your application. These
| routes are loaded by the RouteServiceProvider within a group which
| contains the "web" middleware group. Now create something great!
|
*/
Route::get('chart', [GoogleChartController::class, 'index']);
Step 3: Create Controller
Here, we will create new controller as GoogleChartController. so let's add bellow code on that controller file.
app/Http/Controllers/GoogleChartController.php
<?php
namespace App\Http\Controllers;
use Illuminate\Http\Request;
use App\Models\User;
use DB;
class GoogleChartController extends Controller
{
/**
* Write code on Method
*
* @return response()
*/
public function index()
{
$users = User::select(DB::raw("COUNT(*) as count"), DB::raw("MONTHNAME(created_at) as month_name"))
->whereYear('created_at', date('Y'))
->groupBy(DB::raw("Month(created_at)"))
->pluck('count', 'month_name');
return view('chart', compact('users'));
}
}
Step 4: Create Blade File:
here, we need to create blade file and in this blade file we use google js and use their code.
resources/views/chart.blade.php
<!DOCTYPE html>
<html>
<head>
<title>Laravel 9 Google Chart Example - ItSolutionStuff.com</title>
</head>
<body>
<h1>Laravel 9 Google Chart Example - ItSolutionStuff.com</h1>
<div id="google-line-chart" style="height: 500px"></div>
</body>
<script type="text/javascript" src="https://www.gstatic.com/charts/loader.js"></script>
<script type="text/javascript">
google.charts.load('current', {'packages':['corechart']});
google.charts.setOnLoadCallback(drawChart);
function drawChart() {
var data = google.visualization.arrayToDataTable([
['Month Name', 'Register Users Count'],
@php
foreach($users as $key => $value) {
echo "['".$key."', ".$value."],";
}
@endphp
]);
var options = {
title: 'Register Users Month Wise',
curveType: 'function',
legend: { position: 'bottom' }
};
var chart = new google.visualization.LineChart(document.getElementById('google-line-chart'));
chart.draw(data, options);
}
</script>
</html>
Step 5: Create Dummy Records:
Here, we need to add some dummy records on users table as monthly wise.
you can create dummy records using laravel tinker command as bellow:
php artisan tinker
User::factory()->count(30)->create()
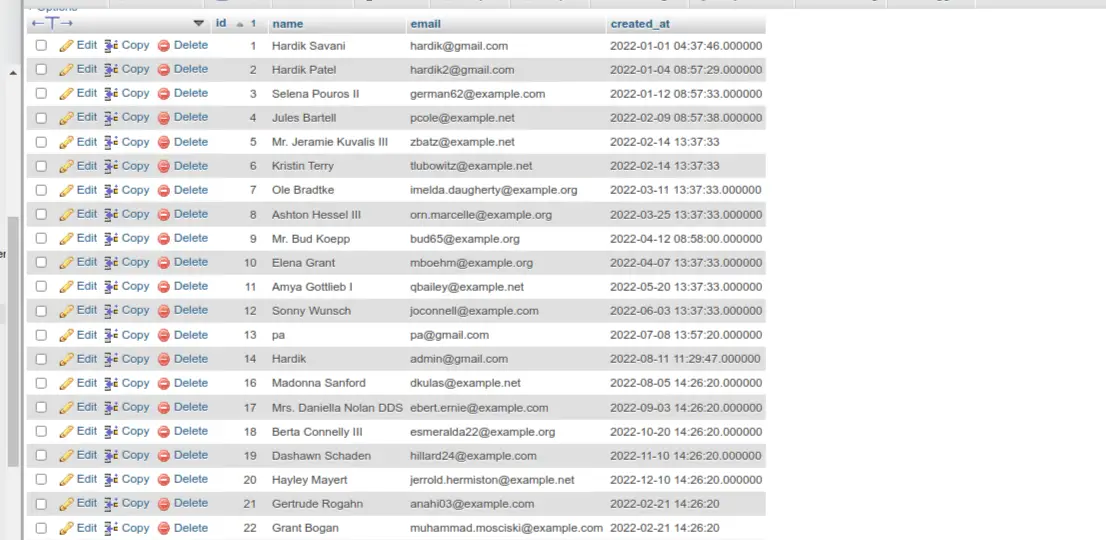
You need to create users on each month with created date as like bellow screen shot:
Run Laravel App:
All the required steps have been done, now you have to type the given below command and hit enter to run the Laravel app:
php artisan serve
Now, Go to your web browser, type the given URL and view the app output:
http://localhost:8000/chart
Output:
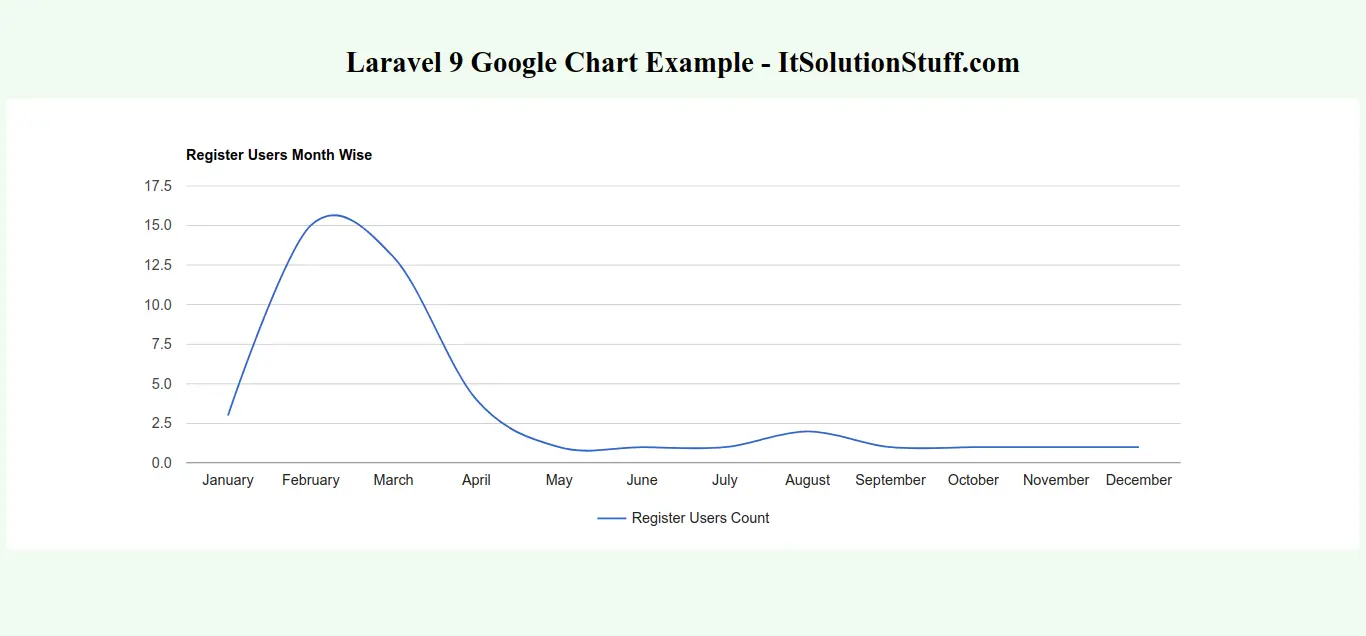
I hope it can help you...