Laravel Ajax ConsoleTvs Charts Tutorial
If you need to add some graphs to your project then i will help you to how to add ajax chart with laravel 6 using consoletvs/charts package. here i will give you example of creating ajax chart with consoletvs/charts in laravel 6 application. consoletvs/charts provide highcharts, chartjs, Fusioncharts, Echarts, Frappe, and c3 ajax chart with laravel 6, laravel 7, laravel 8, laravel 9, laravel 10 and laravel 11 app.
I will give you simple step by step ajax chart using consoletvs/charts in laravel 6. consoletvs/charts provide way to draw chart using ajax method. we might be sometime require to change chart on selected year or value, at that time it's not good if you refresh page and show you new graph, you have to do it using jquery ajax. Using ajax method you can easily create simple chart without reload page.
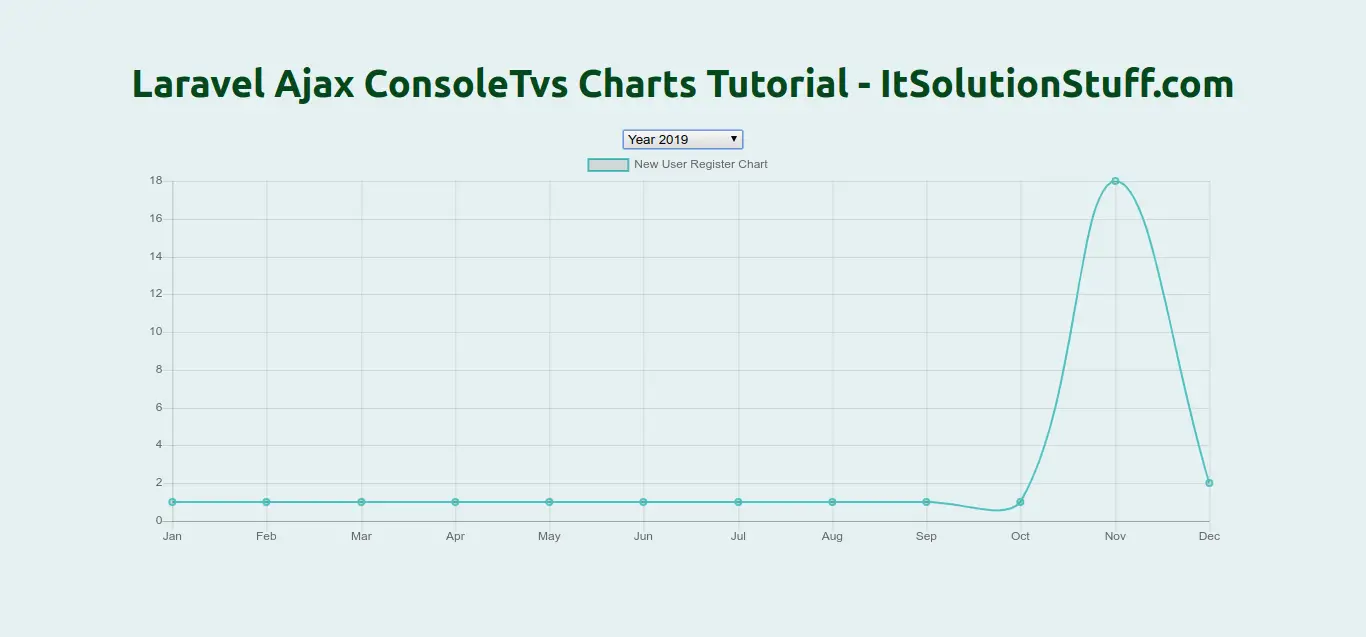
So, let's follow bellow tutorial and you will get simple ajax chart with laravel 6. You can also see demo screen shot, you can understand:
Step 1 : Install Laravel 6
First of all, we need to get fresh laravel 6 version application using bellow command because we are going from scratch, So open your terminal OR command prompt and run bellow command:
composer create-project --prefer-dist laravel/laravel blog
Step 2: Install consoletvs/charts Package
In this step we need to install consoletvs/charts via the Composer package manager, so one your terminal and fire bellow command:
composer require consoletvs/charts
Step 3: Create Route
In this is step we need to create routes for display view and ajax method. so open your "routes/web.php" file and add following route.
routes/web.php
Route::get('chart-line', 'ChartController@chartLine');
Route::get('chart-line-ajax', 'ChartController@chartLineAjax');
Step 4: Create Chart Class
Here, we need to create chart class using consoletvs/charts command, so let's create it like as bellow:
php artisan make:chart UserLineChart Chartjs
Now you can see there is a on UserLineChart.php file, as like bellow:
app/Charts/UserLineChart.php
<?php
namespace App\Charts;
use ConsoleTVs\Charts\Classes\Chartjs\Chart;
class UserLineChart extends Chart
{
/**
* Initializes the chart.
*
* @return void
*/
public function __construct()
{
parent::__construct();
}
}
Step 5:Create Controller:
Here, we will create new controller as ChartController. so let's add bellow code on that controller file.
app/Http/Controllers/ChartController.php
<?php
namespace App\Http\Controllers;
use Illuminate\Http\Request;
use App\User;
use App\Charts\UserLineChart;
class ChartController extends Controller
{
/**
* The attributes that are mass assignable.
*
* @var array
*/
public function chartLine()
{
$api = url('/chart-line-ajax');
$chart = new UserLineChart;
$chart->labels(['Jan', 'Feb', 'Mar', 'Apr', 'May', 'Jun', 'Jul', 'Aug', 'Sep', 'Oct', 'Nov', 'Dec'])->load($api);
return view('chartLine', compact('chart'));
}
/**
* The attributes that are mass assignable.
*
* @var array
*/
public function chartLineAjax(Request $request)
{
$year = $request->has('year') ? $request->year : date('Y');
$users = User::select(\DB::raw("COUNT(*) as count"))
->whereYear('created_at', $year)
->groupBy(\DB::raw("Month(created_at)"))
->pluck('count');
$chart = new UserLineChart;
$chart->dataset('New User Register Chart', 'line', $users)->options([
'fill' => 'true',
'borderColor' => '#51C1C0'
]);
return $chart->api();
}
}
Step 6: Create Blade File:
here, we need to create blade file and in this blade file we use chart js and use their code.
resources/views/chartLine.blade.php
<!DOCTYPE html>
<html>
<head>
<meta charset="utf-8">
<title>Laravel Ajax ConsoleTvs Charts Tutorial - ItSolutionStuff.com</title>
</head>
<body>
<h1>Laravel Ajax ConsoleTvs Charts Tutorial - ItSolutionStuff.com</h1>
<select class="sel" name="year">
<option value="2019">Year 2019</option>
<option value="2018">Year 2018</option>
<option value="2017">Year 2017</option>
</select>
<div style="width: 80%;margin: 0 auto;">
{!! $chart->container() !!}
</div>
<script src="https://cdnjs.cloudflare.com/ajax/libs/jquery/3.4.1/jquery.min.js" ></script>
<script src="https://cdnjs.cloudflare.com/ajax/libs/Chart.js/2.7.1/Chart.min.js" charset="utf-8"></script>
{!! $chart->script() !!}
<script type="text/javascript">
var original_api_url = {{ $chart->id }}_api_url;
$(".sel").change(function(){
var year = $(this).val();
{{ $chart->id }}_refresh(original_api_url + "?year="+year);
});
</script>
</body>
</html>
Step 7: Create Dummy Records:
Here, we need to add some dummy records on users table as monthly wise and add data for two years. You need to create users on each month with created date as like bellow screen shot:
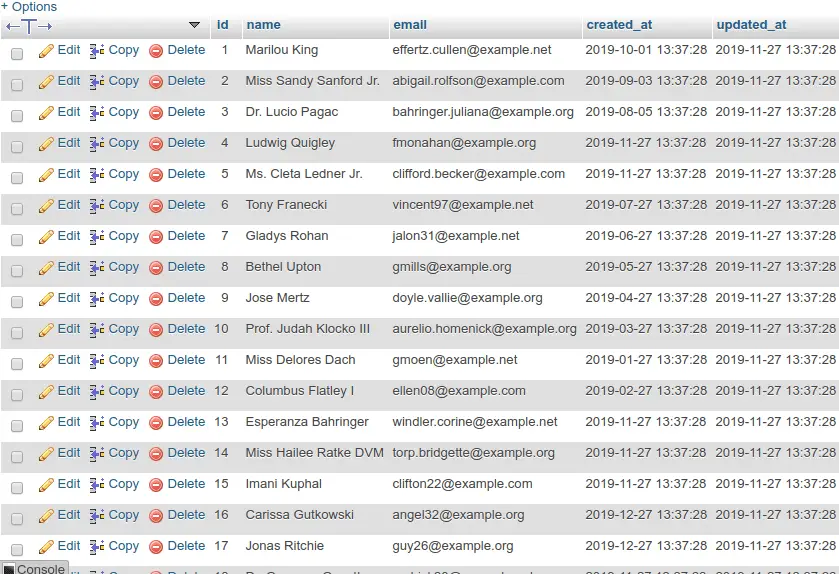
Ok, now you can run and check chart.
I hope it can help you...