Laravel 9 ChartJS Chart Example Tutorial
Hi Dev,
Today our leading topic is laravel 9 chartjs. We will look at an example of laravel 9 chartjs ajax example. I explained simply step by step how to create a chart in laravel 9. This tutorial will give you a simple example of how to use chartjs in laravel 9. Here, Creating a basic example of chartjs laravel 9 examples.
you can simply use Line Charts, Bar Charts, Pie Charts, Area Charts, etc using chartjs js.
Chartjs is a js library, this library through we can use bar chart, line chart, area chart, column chart, etc. chartjs is a open-source chart library. chartjs also provide several theme and graph that way you can use more chart from here : chartjs Site.
In this example, we will create some dummy users records and then we will display a line chart with all months of current years. so let's follow the below step and add a chart in your laravel 9 app.

Step 1: Install Laravel 9
This is optional; however, if you have not created the laravel app, then you may go ahead and execute the below command:
composer create-project laravel/laravel example-app
Step 2: Create Route
first of all we will create simple route for creating simple line chart. so let's add simple routes as like bellow:
routes/web.php
<?php
use Illuminate\Support\Facades\Route;
use App\Http\Controllers\ChartJSController;
/*
|--------------------------------------------------------------------------
| Web Routes
|--------------------------------------------------------------------------
|
| Here is where you can register web routes for your application. These
| routes are loaded by the RouteServiceProvider within a group which
| contains the "web" middleware group. Now create something great!
|
*/
Route::get('chart', [ChartJSController::class, 'index']);
Step 3: Create Controller
Here, we will create new controller as ChartJSController. so let's add bellow code on that controller file.
app/Http/Controllers/ChartJSController.php
<?php
namespace App\Http\Controllers;
use Illuminate\Http\Request;
use App\Models\User;
use DB;
class ChartJSController extends Controller
{
/**
* Write code on Method
*
* @return response()
*/
public function index()
{
$users = User::select(DB::raw("COUNT(*) as count"), DB::raw("MONTHNAME(created_at) as month_name"))
->whereYear('created_at', date('Y'))
->groupBy(DB::raw("Month(created_at)"))
->pluck('count', 'month_name');
$labels = $users->keys();
$data = $users->values();
return view('chart', compact('labels', 'data'));
}
}
Step 4: Create Blade File:
here, we need to create blade file and in this blade file we use highchart js and use their code.
resources/views/chart.blade.php
<!DOCTYPE html>
<html>
<head>
<title>Laravel 9 ChartJS Chart Example - ItSolutionStuff.com</title>
</head>
<body>
<h1>Laravel 9 ChartJS Chart Example - ItSolutionStuff.com</h1>
<canvas id="myChart" height="100px"></canvas>
</body>
<script src="https://cdnjs.cloudflare.com/ajax/libs/jquery/3.6.0/jquery.min.js" ></script>
<script src="https://cdn.jsdelivr.net/npm/chart.js"></script>
<script type="text/javascript">
var labels = {{ Js::from($labels) }};
var users = {{ Js::from($data) }};
const data = {
labels: labels,
datasets: [{
label: 'My First dataset',
backgroundColor: 'rgb(255, 99, 132)',
borderColor: 'rgb(255, 99, 132)',
data: users,
}]
};
const config = {
type: 'line',
data: data,
options: {}
};
const myChart = new Chart(
document.getElementById('myChart'),
config
);
</script>
</html>
Step 5: Create Dummy Records:
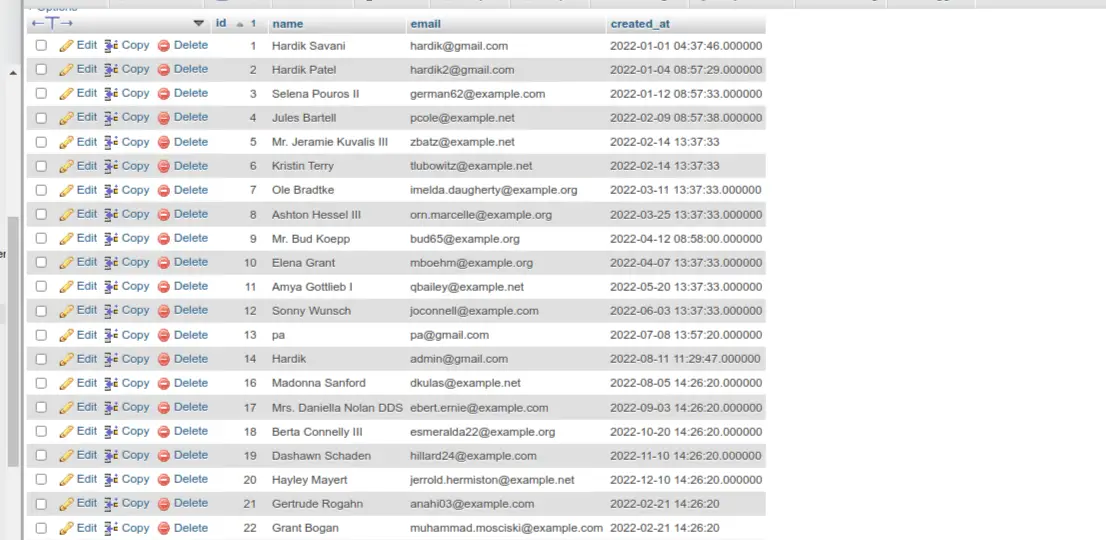
Here, we need to add some dummy records on users table as monthly wise.
you can create dummy records using laravel tinker command as bellow:
php artisan tinker
User::factory()->count(30)->create()
You need to create users on each month with created date as like bellow screen shot:
Run Laravel App:
All the required steps have been done, now you have to type the given below command and hit enter to run the Laravel app:
php artisan serve
Now, Go to your web browser, type the given URL and view the app output:
http://localhost:8000/chart
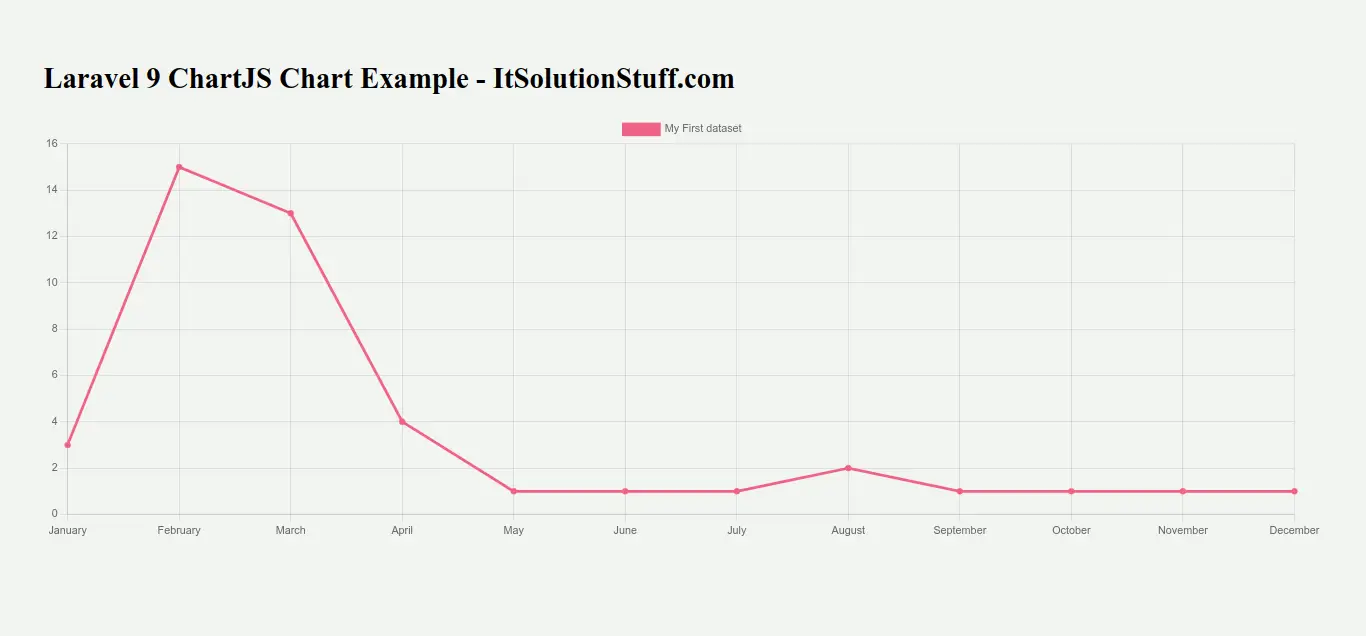
Output:
I hope it can help you...