Laravel 7/6 Highcharts Tutorial
Today, i will guide you how to add chart using Highcharts in laravel 7/6. i will explain step by step laravel 7/6 highcharts example. you can simply use Line Charts, Bar Charts, Pie Charts, Area Charts etc. we will create line highchart with laravel 7/6.
Highcharts is a js library, this library through we can use bar chart, line chart, area chart, column chart etc. Highcharts is a open source chart library. Highcharts also provide sevral theme and graph that way you can use more chart from here : HighCharts Site.
whenever you need to add charts in laravel 6 server side. then you can easily use following example you have to fetch data from database and then set in Highcharts function, so let's see how to use Highcharts in larave with proper example.
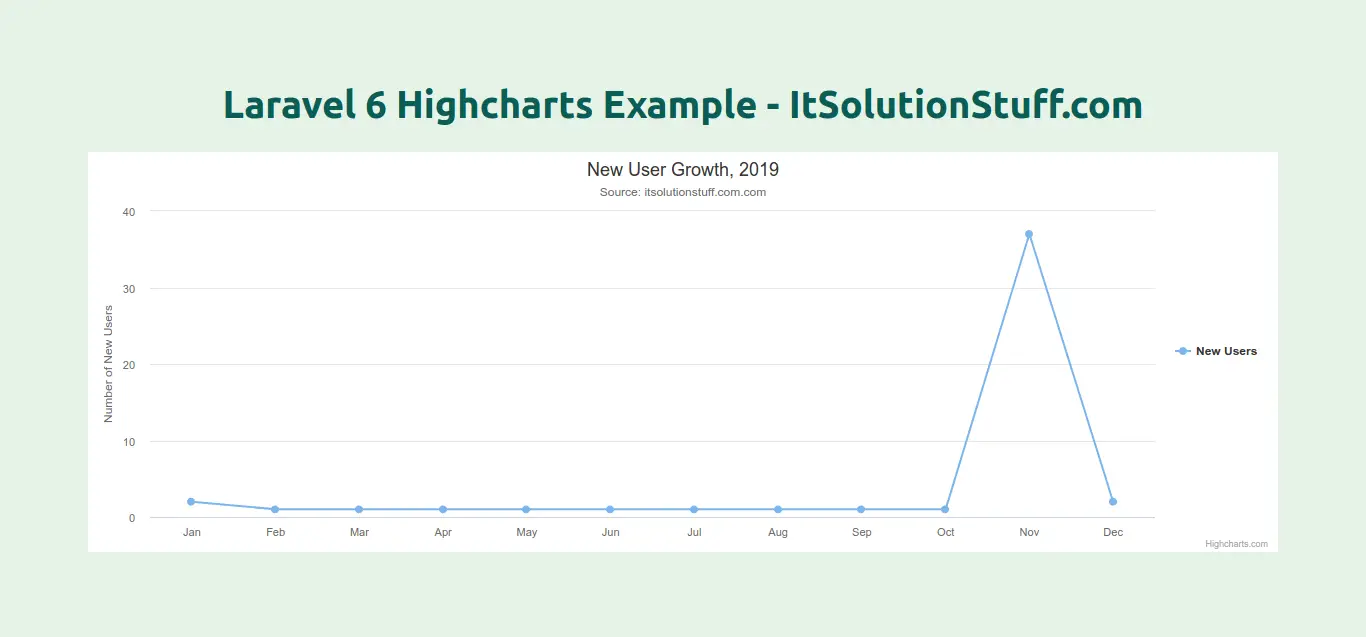
Preview:
Create Route:
first of all we will create simple route for creating simple line chart. so let's add simple routes as like bellow:
routes/web.php
Route::get('chart', 'ChartController@index');
Create Controller:
Here, we will create new controller as ChartController. so let's add bellow code on that controller file.
app/Http/Controllers/ChartController.php
<?php
namespace App\Http\Controllers;
use Illuminate\Http\Request;
use App\User;
class ChartController extends Controller
{
/**
* The attributes that are mass assignable.
*
* @var array
*/
public function index()
{
$users = User::select(\DB::raw("COUNT(*) as count"))
->whereYear('created_at', date('Y'))
->groupBy(\DB::raw("Month(created_at)"))
->pluck('count');
return view('chart', compact('users'));
}
}
Create Blade File:
here, we need to create blade file and in this blade file we use highchart js and use their code.
resources/views/chart.blade.php
<!DOCTYPE html>
<html>
<head>
<title>Laravel 6 Highcharts Example - ItSolutionStuff.com</title>
</head>
<body>
<h1>Laravel 6 Highcharts Example - ItSolutionStuff.com</h1>
<div id="container"></div>
</body>
<script src="https://code.highcharts.com/highcharts.js"></script>
<script type="text/javascript">
var users = <?php echo json_encode($users) ?>;
Highcharts.chart('container', {
title: {
text: 'New User Growth, 2019'
},
subtitle: {
text: 'Source: itsolutionstuff.com.com'
},
xAxis: {
categories: ['Jan', 'Feb', 'Mar', 'Apr', 'May', 'Jun', 'Jul', 'Aug', 'Sep', 'Oct', 'Nov', 'Dec']
},
yAxis: {
title: {
text: 'Number of New Users'
}
},
legend: {
layout: 'vertical',
align: 'right',
verticalAlign: 'middle'
},
plotOptions: {
series: {
allowPointSelect: true
}
},
series: [{
name: 'New Users',
data: users
}],
responsive: {
rules: [{
condition: {
maxWidth: 500
},
chartOptions: {
legend: {
layout: 'horizontal',
align: 'center',
verticalAlign: 'bottom'
}
}
}]
}
});
</script>
</html>
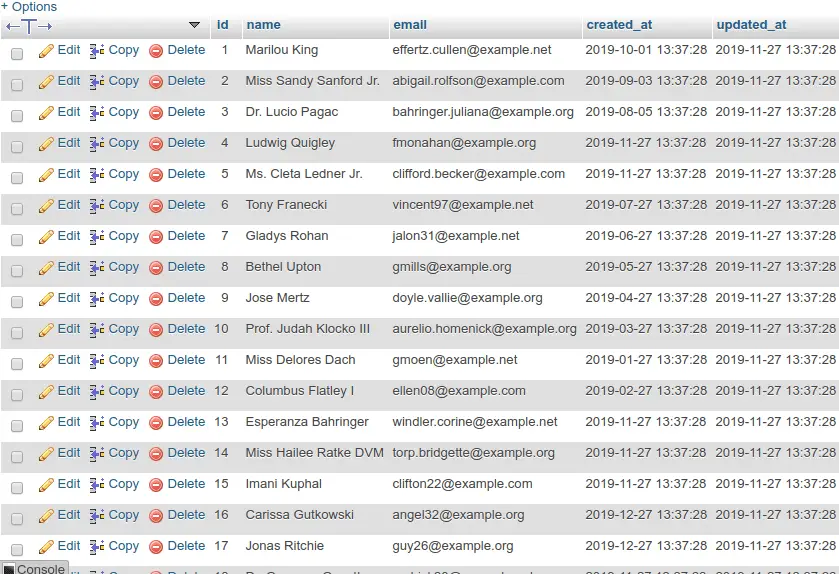
Create Dummy Records:
Here, we need to add some dummy records on users table as monthly wise. You need to create users on each month with created date as like bellow screen shot:
Ok, now you can run and check chart.
I hope it can help you...