How to use Google Charts in Laravel 8?
Hi All,
In this short tutorial we will cover an laravel 8 google chart example. you will learn dynamic charts in laravel 8. This tutorial will give you simple example of how to use google charts in laravel 8. it's simple example of laravel 8 google line chart example. So, let's follow few step to create example of laravel 8 google charts api example.
In now-days, Google have several popular API like map, chart, analytics etc. Google charts JS API is also very popular and it is pretty simple to integrate with our application or projects. In this post, i going to give you example of Google line chart, How to user Google line chart in your laravel application.
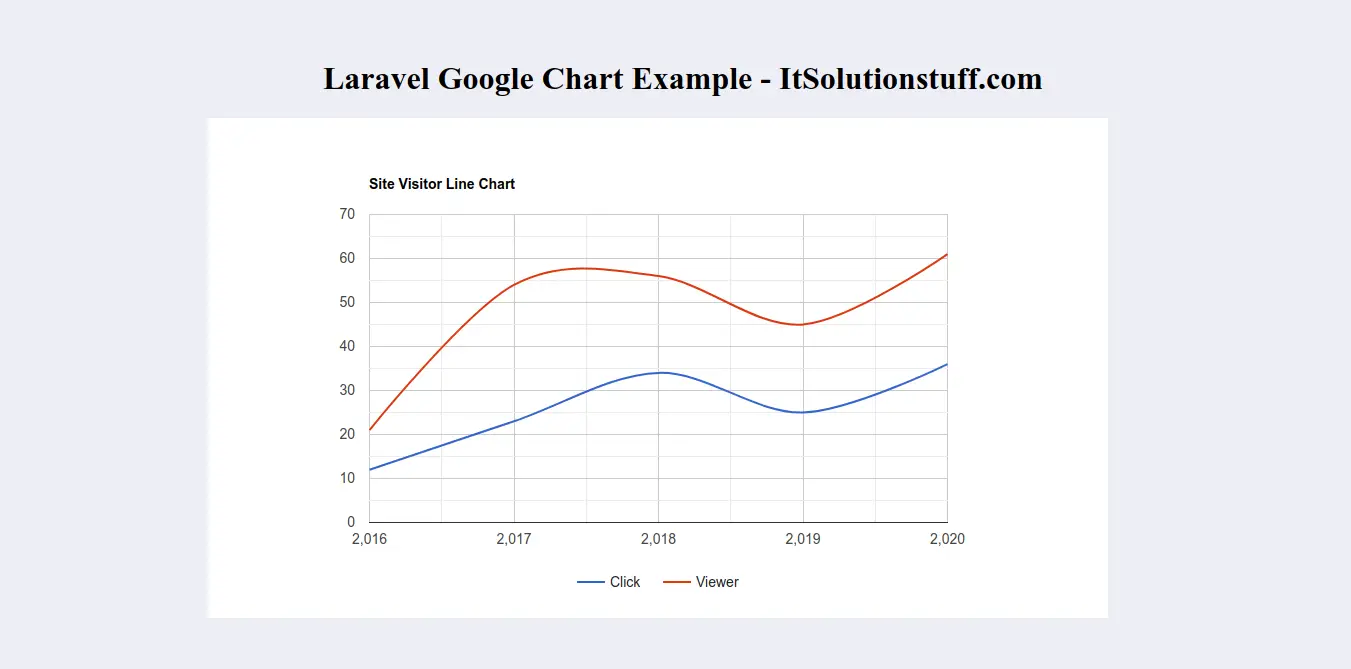
Google charts js provide several other charts like bar chart, Area chart, Column Chart, Pie Chart, GEO Chart etc. In this post we will use line chart with good graphical way. you can use in your laravel application, you just follow few step, after you can get output as bellow preview.
Preview:
Step 1: Install Laravel
first of all we need to get fresh Laravel application using bellow command, So open your terminal OR command prompt and run bellow command:
composer create-project --prefer-dist laravel/laravel blogFirebase
Step 2: Create Migration and Model
we require to create new table "visitors" that way we will get data from this table, you can use your own table but this is for example. we have to create migration for visitors table using Laravel 5 php artisan command, so first fire bellow command:
php artisan make:migration create_visitor_table
After this command you will find one file in following path database/migrations and you have to put bellow code in your migration file for create visitors table.
<?php
use Illuminate\Database\Migrations\Migration;
use Illuminate\Database\Schema\Blueprint;
use Illuminate\Support\Facades\Schema;
class CreateVisitorTable extends Migration
{
/**
* Run the migrations.
*
* @return void
*/
public function up()
{
Schema::create('visitors', function (Blueprint $table) {
$table->id();
$table->integer('click');
$table->integer('viewer');
$table->timestamps();
});
}
/**
* Reverse the migrations.
*
* @return void
*/
public function down()
{
Schema::dropIfExists('visitor');
}
}
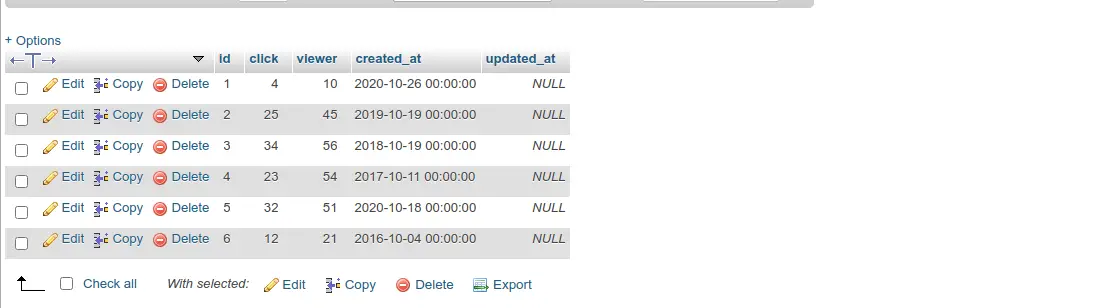
Ok, now you can add few records like as bellow:
Let's create model using bellow command:
php artisan make:model Visitor
app/Http/Controllers/HomeController.php
<?php
namespace App\Models;
use Illuminate\Database\Eloquent\Factories\HasFactory;
use Illuminate\Database\Eloquent\Model;
class Visitor extends Model
{
use HasFactory;
}
Step 3: Add Route
In this is step we need to add route for generate view. so open your route file and add following route.
routes/web.php
<?php
use Illuminate\Support\Facades\Route;
use App\Http\Controllers\HomeController;
/*
|--------------------------------------------------------------------------
| Web Routes
|--------------------------------------------------------------------------
|
| Here is where you can register web routes for your application. These
| routes are loaded by the RouteServiceProvider within a group which
| contains the "web" middleware group. Now create something great!
|
*/
Route::get('google-line-chart', [HomeController::class, 'googleLineChart']);
Step 4: Create Controller
If you haven't HomeController then we should create new controller as HomeController in this path app/Http/Controllers/HomeController.php. Make sure you should have visitor table with some data. this controller will manage data and chart data and view file, so put bellow content in controller file:
app/Http/Controllers/HomeController.php
<?php
namespace App\Http\Controllers;
use Illuminate\Http\Request;
use App\Models\Visitor;
use DB;
class HomeController extends Controller
{
/**
* Create a new controller instance.
*
* @return void
*/
public function googleLineChart()
{
$visitor = Visitor::select(
DB::raw("year(created_at) as year"),
DB::raw("SUM(click) as total_click"),
DB::raw("SUM(viewer) as total_viewer"))
->orderBy(DB::raw("YEAR(created_at)"))
->groupBy(DB::raw("YEAR(created_at)"))
->get();
$result[] = ['Year','Click','Viewer'];
foreach ($visitor as $key => $value) {
$result[++$key] = [$value->year, (int)$value->total_click, (int)$value->total_viewer];
}
return view('google-line-chart')
->with('visitor',json_encode($result));
}
}
Step 5: Create View File
In last step, we have to create view file "google-line-chart.blade.php" for generate view chart, so create google-line-chart file and put bellow code:
resources/view/google-line-chart.blade.php
<html>
<head>
<script type="text/javascript" src="https://www.gstatic.com/charts/loader.js"></script>
<script type="text/javascript">
var visitor = <?php echo $visitor; ?>;
console.log(visitor);
google.charts.load('current', {'packages':['corechart']});
google.charts.setOnLoadCallback(drawChart);
function drawChart() {
var data = google.visualization.arrayToDataTable(visitor);
var options = {
title: 'Site Visitor Line Chart',
curveType: 'function',
legend: { position: 'bottom' }
};
var chart = new google.visualization.LineChart(document.getElementById('linechart'));
chart.draw(data, options);
}
</script>
</head>
<body>
<h1>Laravel Google Chart Example - ItSolutionstuff.com</h1>
<div id="linechart" style="width: 900px; height: 500px"></div>
</body>
</html>
Now you can run and check.
I hope it can help you...