Laravel 11 Chart using Highcharts JS Example
This tutorial demonstrates how to create charts in Laravel 11 with Highcharts JS. We will gradually look into the entire process of working with laravel 11 and highcharts with examples.
Highcharts JS is a popular JavaScript charting library that is designed to create interactive and visually stunning charts and graphs for web pages. It provides a wide range of chart and graph types such as line chart, area chart, bar chart, column chart, pie chart, scatter chart, and more, which can be customized through a vast number of configuration options.
In this example, we will create some dummy user records and then display a line chart with all months of the current year. So let's follow the below steps and add a chart to your Laravel 11 apps.

Step for How to Create Chart using Highcharts in Laravel 11?
- Step 1: Install Laravel 11
- Step 2: Create Route
- Step 3: Create Controller
- Step 4: Create Blade File
- Step 5: Create Dummy Records
- Run Laravel App
Step 1: Install Laravel 11
This step is not required; however, if you have not created the Laravel app, then you may go ahead and execute the below command:
composer create-project laravel/laravel example-appStep 2: Create Route
First of all, we will create a simple route for creating a simple line chart. So let's add simple routes as below:
routes/web.php
<?php

use Illuminate\Support\Facades\Route;

use App\Http\Controllers\HighchartController;

Route::get('chart', [HighchartController::class, 'index']);
Step 3: Create Controller
Here, we will create a new controller named HighchartController. So let's add the code below to that controller file.
app/Http/Controllers/HighchartController.php
<?php

namespace App\Http\Controllers;

use Illuminate\Http\Request;
use App\Models\User;
use DB;
use Illuminate\View\View;

class HighchartController extends Controller
{
    /**
     * Write code on Method
     *
     * @return response()
     */
    public function index(): View
    {
        $users = User::select(DB::raw("COUNT(*) as count"))
                    ->whereYear('created_at', date('Y'))
                    ->groupBy(DB::raw("Month(created_at)"))
                    ->pluck('count');

        return view('chart', compact('users'));
    }
}
Step 4: Create Blade File
here, we need to create blade file and in this blade file we use highchart js and use their code.
resources/views/chart.blade.php
<!DOCTYPE html>
<html>
<head>
    <title>Laravel 11 Highcharts Chart Example - ItSolutionStuff.com</title>
    <link href="https://cdn.jsdelivr.net/npm/bootstrap@5.0.2/dist/css/bootstrap.min.css" rel="stylesheet" crossorigin="anonymous">
</head>

<body>
    <div class="container">
        <div class="card mt-5">
            <h3 class="card-header p-3">Laravel 11 Highcharts Chart Example - ItSolutionStuff.com</h3>
            <div class="card-body">
                <div id="container"></div>
            </div>
        </div>
    </div>
</body>

<script src="https://code.highcharts.com/highcharts.js"></script>
<script type="text/javascript">
    var users =  {{ Js::from($users) }};

    Highcharts.chart('container', {
        title: {
            text: 'New User Growth, 2022'
        },
        subtitle: {
            text: 'Source: itsolutionstuff.com.com'
        },
         xAxis: {
            categories: ['Jan', 'Feb', 'Mar', 'Apr', 'May', 'Jun', 'Jul', 'Aug', 'Sep', 'Oct', 'Nov', 'Dec']
        },
        yAxis: {
            title: {
                text: 'Number of New Users'
            }
        },
        legend: {
            layout: 'vertical',
            align: 'right',
            verticalAlign: 'middle'
        },
        plotOptions: {
            series: {
                allowPointSelect: true
            }
        },
        series: [{
            name: 'New Users',
            data: users
        }],
        responsive: {
            rules: [{
                condition: {
                    maxWidth: 500
                },
                chartOptions: {
                    legend: {
                        layout: 'horizontal',
                        align: 'center',
                        verticalAlign: 'bottom'
                    }
                }
            }]
        }
});
</script>
</html>
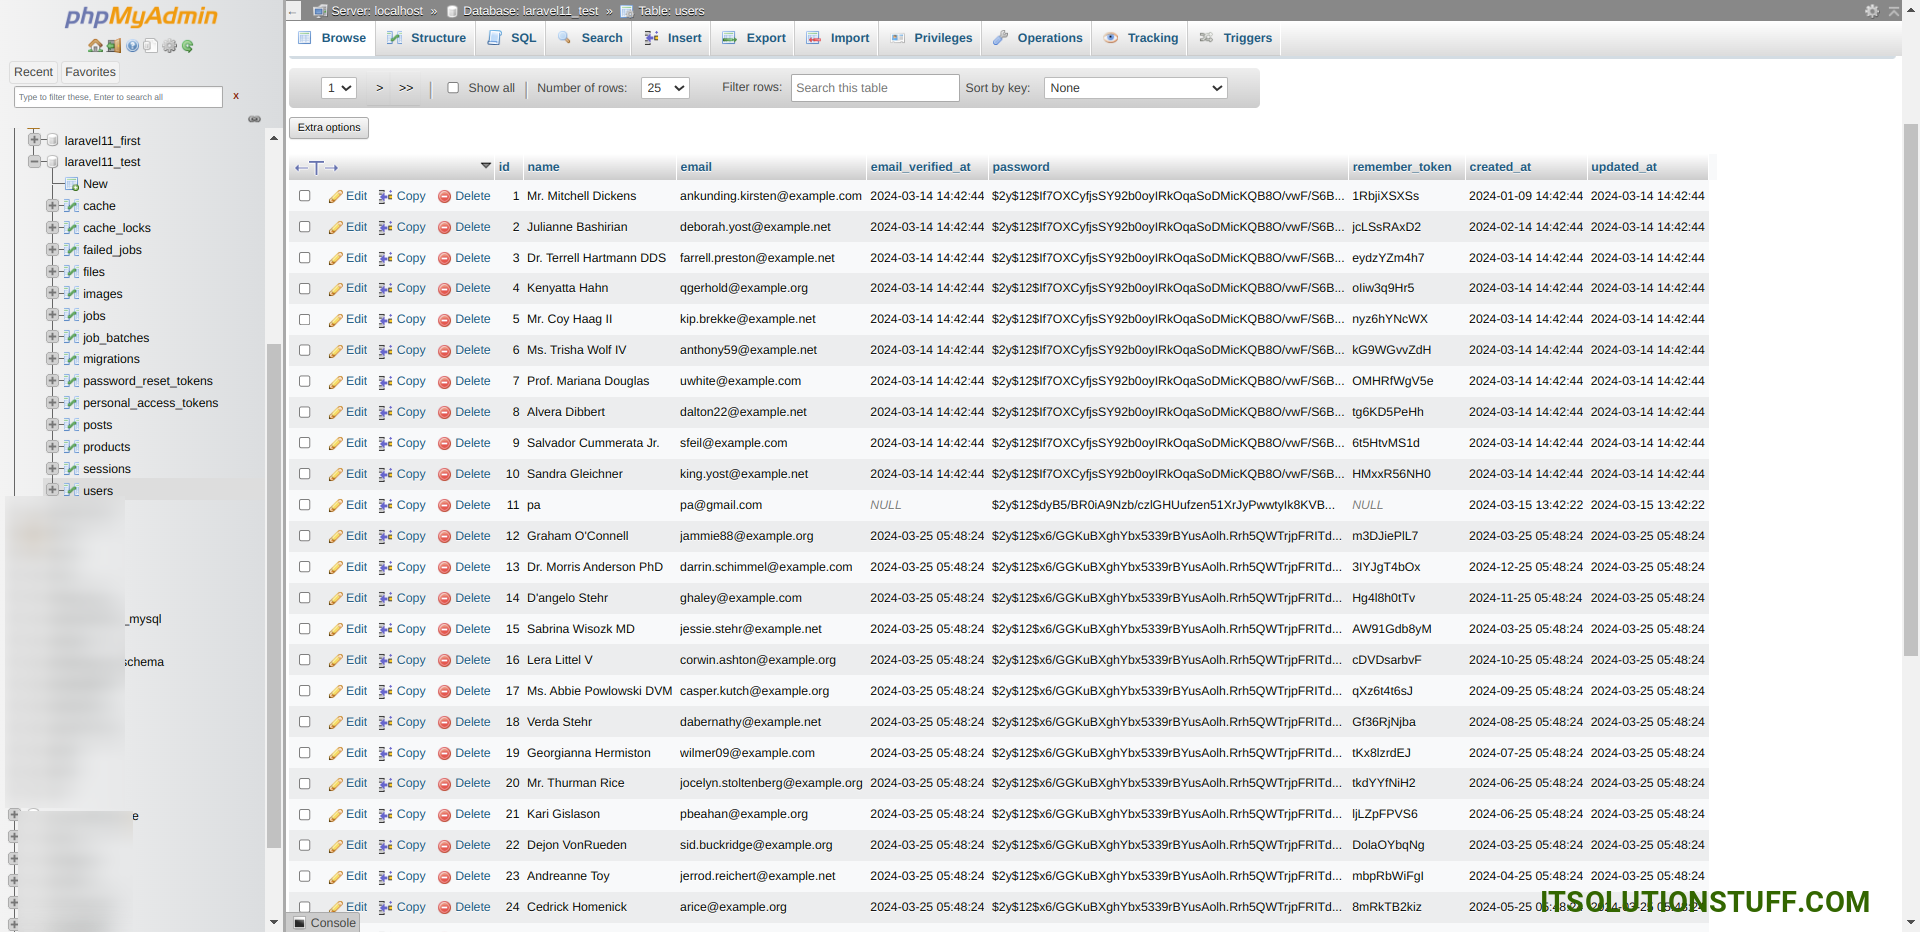
Step 5: Create Dummy Records:
Here, we need to add some dummy records on users table as monthly wise.
you can create dummy records using laravel tinker command as bellow:
php artisan tinker

User::factory()->count(30)->create()
You need to create users on each month with created date as like bellow screen shot:
Run Laravel App:
All the required steps have been done, now you have to type the given below command and hit enter to run the Laravel app:
php artisan serveNow, Go to your web browser, type the given URL and view the app output:
http://localhost:8000/chartOutput:
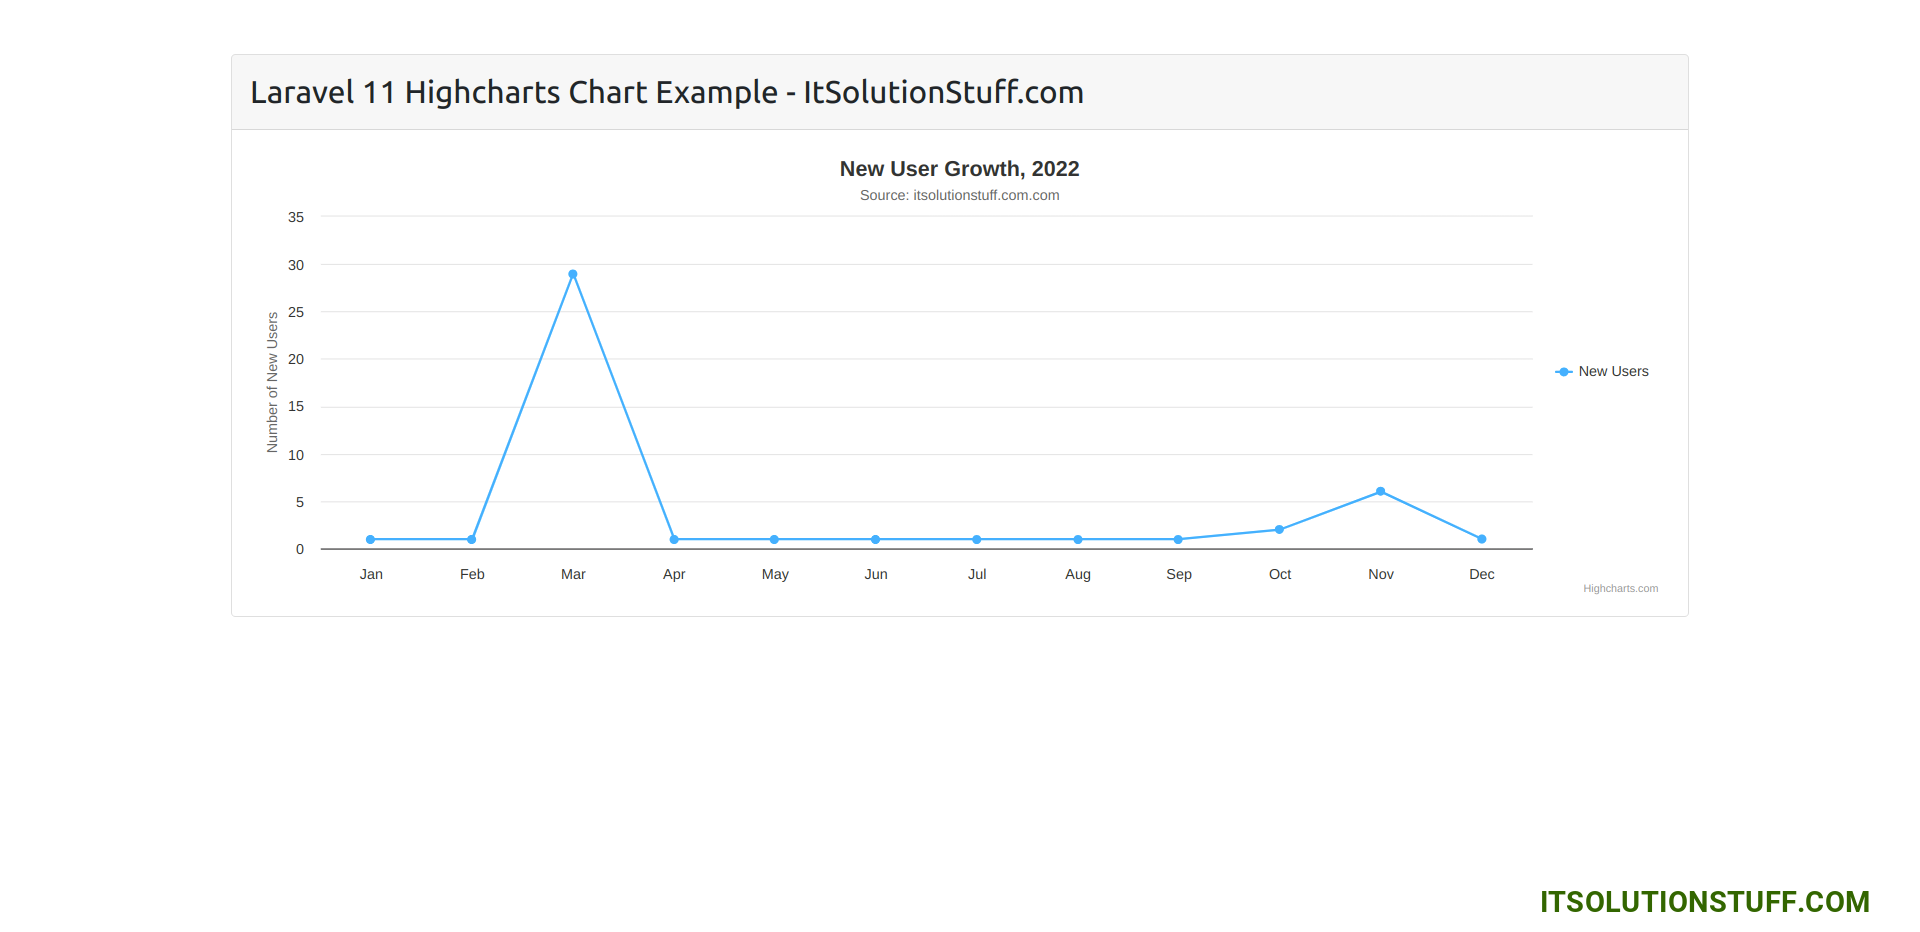
I hope it can help you...