Angular 11 Bubble Chart using ng2-charts Example
This example is focused on angular 11 bubble chart example. i would like to show you angular 11 bubble chart npm. let’s discuss about angular 11 ng2-charts bubble chart . you will learn how to add bubble chart in angular 11. Alright, let’s dive into the steps.
In this example we will use ng2-charts npm package to create bubble chart example in angular 11 application. we will simply install that ng2-charts npm package and use ChartsModule module to create code.
So, let's see bellow step and get qr code as like bellow screenshot:
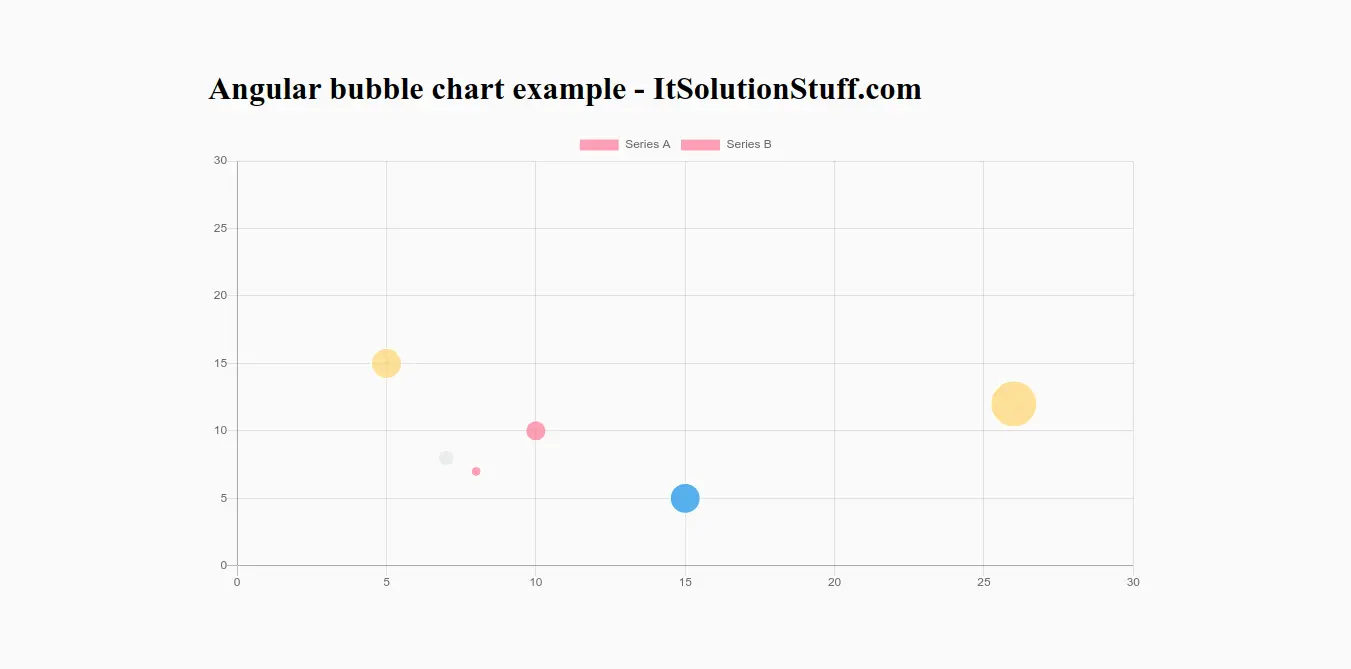
Preview:
Step 1: Create New App
You can easily create your angular app using bellow command:
ng new myNewApp
Step 2: Install ng2-charts npm Package
Now in this step, we need to just install ng2-charts in our angular application. so let's add as like bellow:
npm install ng2-charts chart.js --save
Step 3: Import ChartsModule
we will import ChartsModule module as like bellow code:
src/app/app.module.ts
import { NgModule } from '@angular/core';
import { BrowserModule } from '@angular/platform-browser';
import { FormsModule } from '@angular/forms';
import { AppComponent } from './app.component';
import { ChartsModule } from 'ng2-charts';
@NgModule({
imports: [ BrowserModule, FormsModule, ChartsModule ],
declarations: [ AppComponent ],
bootstrap: [ AppComponent ]
})
export class AppModule { }
Step 4: Update Ts File
here, we need to update ts file as like bellow:
src/app/app.component.ts
import { Component, OnInit } from '@angular/core';
import { ChartOptions, ChartType, ChartDataSets } from 'chart.js';
import { Color } from 'ng2-charts';
@Component({
selector: 'my-app',
templateUrl: './app.component.html',
styleUrls: ['./app.component.css']
})
export class AppComponent {
public bubbleChartOptions: ChartOptions = {
responsive: true,
scales: {
xAxes: [{
ticks: {
min: 0,
max: 30,
}
}],
yAxes: [{
ticks: {
min: 0,
max: 30,
}
}]
}
};
public bubbleChartType: ChartType = 'bubble';
public bubbleChartLegend = true;
public bubbleChartData: ChartDataSets[] = [
{
data: [
{ x: 10, y: 10, r: 10 },
{ x: 15, y: 5, r: 15 },
{ x: 26, y: 12, r: 23 },
{ x: 7, y: 8, r: 8 },
],
label: 'Series A',
},
{
data: [
{ x: 8, y: 7, r: 5 },
{ x: 15, y: 5, r: 15 },
{ x: 5, y: 15, r: 15 },
{ x: 7, y: 8, r: 8 },
],
label: 'Series B',
},
];
constructor() { }
ngOnInit() {
}
}
Step 5: Update HTML File
here, we need to update html file as like bellow code:
src/app/app.component.html
<h1>Angular bubble chart example - ItSolutionStuff.com</h1>
<div style="display: block;">
<canvas baseChart
[datasets]="bubbleChartData"
[options]="bubbleChartOptions"
[colors]="bubbleChartColors"
[legend]="bubbleChartLegend"
[chartType]="bubbleChartType">
</canvas>
</div>
Now you can run by bellow command:
ng serve
now you can check it.
I hope it can help you...