Laravel 10 Highcharts Tutorial Example
Hi Developer,
This tutorial is focused on laravel 10 highcharts. This tutorial will give you a simple example of laravel 10 highcharts ajax example. you'll learn how to create chart in laravel 10. you can see how to use highcharts in laravel 10. So, let's follow a few steps to create an example of highcharts laravel 10 example.
Highcharts JS is a popular JavaScript charting library that is designed to create interactive and visually stunning charts and graphs for web pages. It provides a wide range of charts and graph types such as line chart, area chart, bar chart, column chart, pie chart, scatter chart, and more, which can be customized through a vast number of configuration options.
In this example, we will create some dummy user records and then we will display a line chart with all months of the current year. so let's follow the below step and add a chart to your laravel 10 apps.

Step 1: Install Laravel 10
This is optional; however, if you have not created the laravel app, then you may go ahead and execute the below command:
composer create-project laravel/laravel example-app
Step 2: Create Route
first of all we will create simple route for creating simple line chart. so let's add simple routes as like bellow:
routes/web.php
<?php
use Illuminate\Support\Facades\Route;
use App\Http\Controllers\HighchartController;
/*
|--------------------------------------------------------------------------
| Web Routes
|--------------------------------------------------------------------------
|
| Here is where you can register web routes for your application. These
| routes are loaded by the RouteServiceProvider within a group which
| contains the "web" middleware group. Now create something great!
|
*/
Route::get('chart', [HighchartController::class, 'index']);
Step 3: Create Controller
Here, we will create new controller as HighchartController. so let's add bellow code on that controller file.
app/Http/Controllers/HighchartController.php
<?php
namespace App\Http\Controllers;
use Illuminate\Http\Request;
use App\Models\User;
use DB;
use Illuminate\View\View;
class HighchartController extends Controller
{
/**
* Write code on Method
*
* @return response()
*/
public function index(): View
{
$users = User::select(DB::raw("COUNT(*) as count"))
->whereYear('created_at', date('Y'))
->groupBy(DB::raw("Month(created_at)"))
->pluck('count');
return view('chart', compact('users'));
}
}
Step 4: Create Blade File:
here, we need to create blade file and in this blade file we use highchart js and use their code.
resources/views/chart.blade.php
<!DOCTYPE html>
<html>
<head>
<title>Laravel 10 Highcharts Example - ItSolutionStuff.com</title>
</head>
<body>
<h1>Laravel 10 Highcharts Example - ItSolutionStuff.com</h1>
<div id="container"></div>
</body>
<script src="https://code.highcharts.com/highcharts.js"></script>
<script type="text/javascript">
var users = {{ Js::from($users) }};
Highcharts.chart('container', {
title: {
text: 'New User Growth, 2022'
},
subtitle: {
text: 'Source: itsolutionstuff.com.com'
},
xAxis: {
categories: ['Jan', 'Feb', 'Mar', 'Apr', 'May', 'Jun', 'Jul', 'Aug', 'Sep', 'Oct', 'Nov', 'Dec']
},
yAxis: {
title: {
text: 'Number of New Users'
}
},
legend: {
layout: 'vertical',
align: 'right',
verticalAlign: 'middle'
},
plotOptions: {
series: {
allowPointSelect: true
}
},
series: [{
name: 'New Users',
data: users
}],
responsive: {
rules: [{
condition: {
maxWidth: 500
},
chartOptions: {
legend: {
layout: 'horizontal',
align: 'center',
verticalAlign: 'bottom'
}
}
}]
}
});
</script>
</html>
Step 5: Create Dummy Records:
Here, we need to add some dummy records on users table as monthly wise.
you can create dummy records using laravel tinker command as bellow:
php artisan tinker
User::factory()->count(30)->create()
You need to create users on each month with created date.
Run Laravel App:
All the required steps have been done, now you have to type the given below command and hit enter to run the Laravel app:
php artisan serve
Now, Go to your web browser, type the given URL and view the app output:
http://localhost:8000/chart
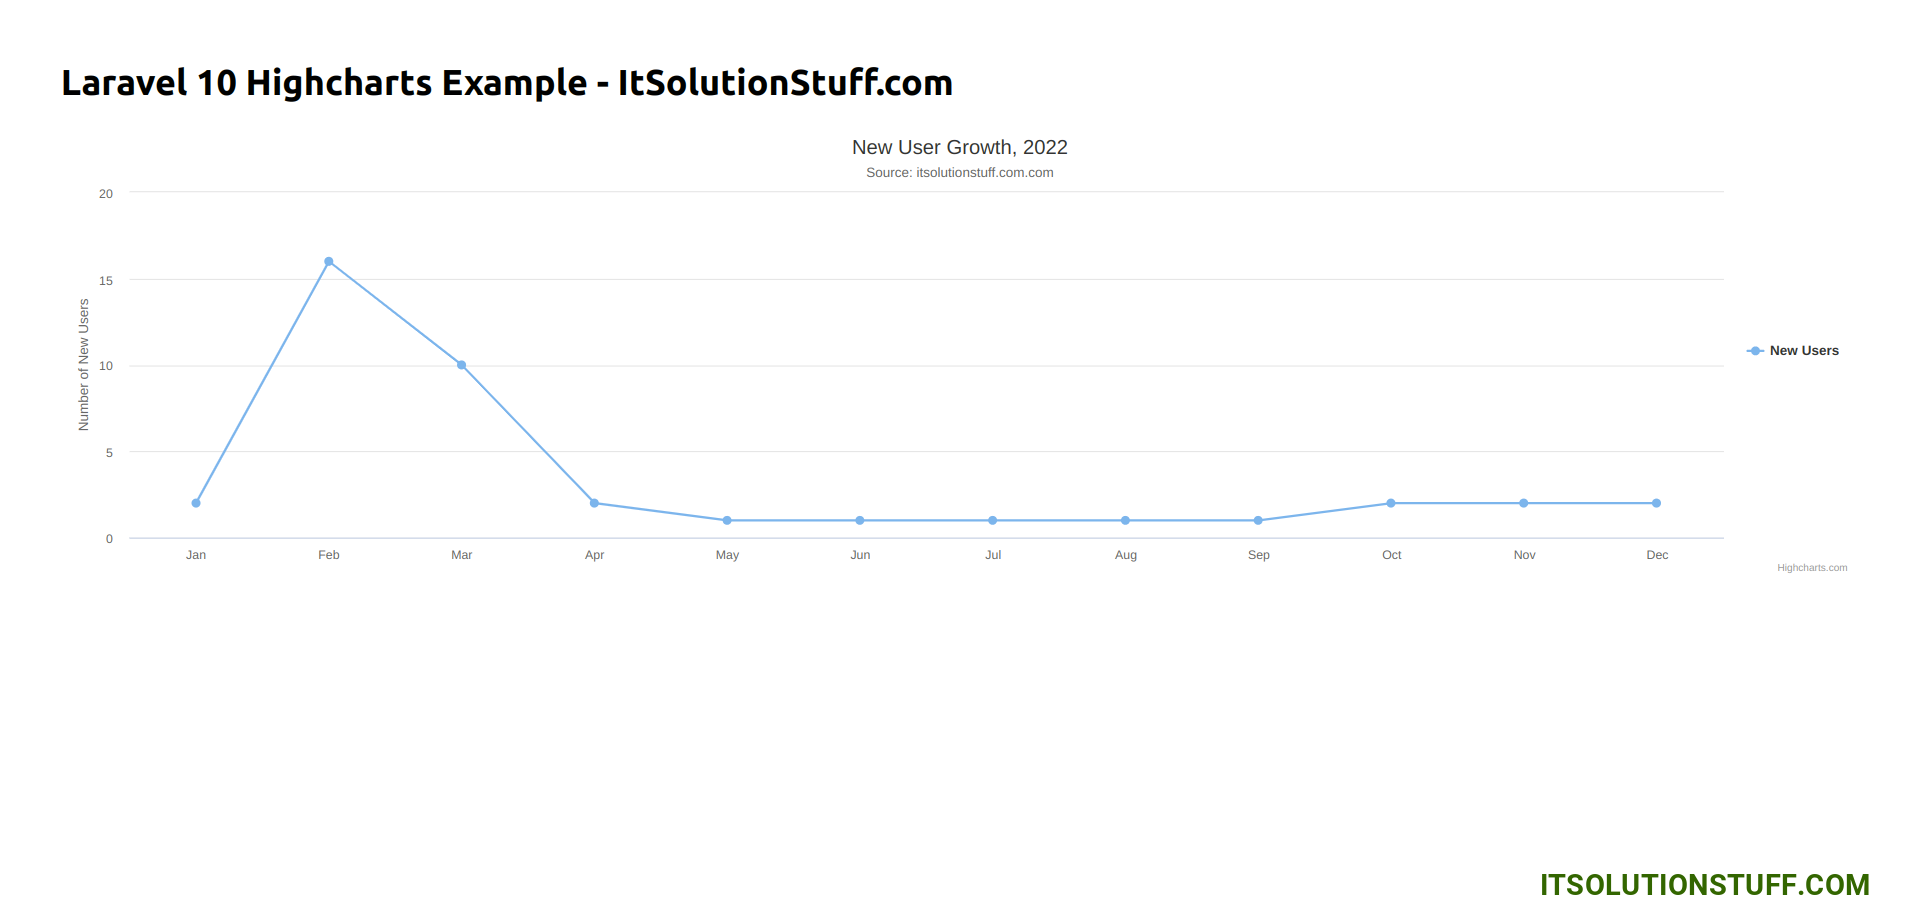
Output:
I hope it can help you...